- Records
- 412
- Columns
- 14
- Data through
- 2025
- Source updates
- annual
- Issue collected
- 2026-08-11
- Licence
- CC-BY-4.0
What you get
- 412-row CSV14 typed columns, ready for pandas, Excel or SQL
- PDF intelligence briefthe analytics read and methodology, written against this issue
- 4 chartspublication-ready PNGs of the headline relationships
- analytics.md + statistics.mdthe same findings as text, for quoting and reuse
- Versioned archiveevery past issue stays downloadable, so you can build a time series
- API accesspull the data with a scoped key instead of clicking download
What the current issue shows
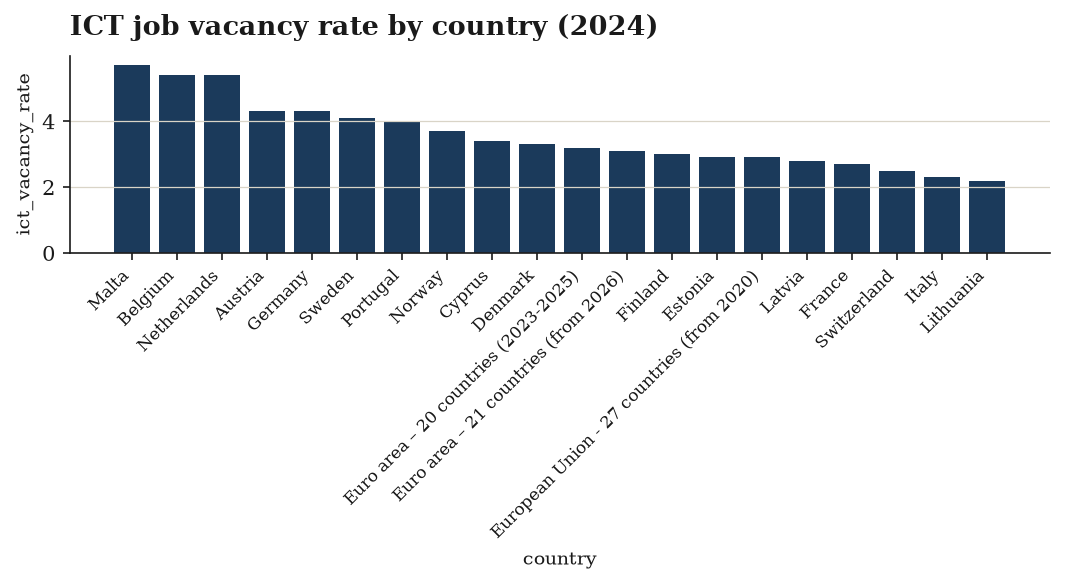
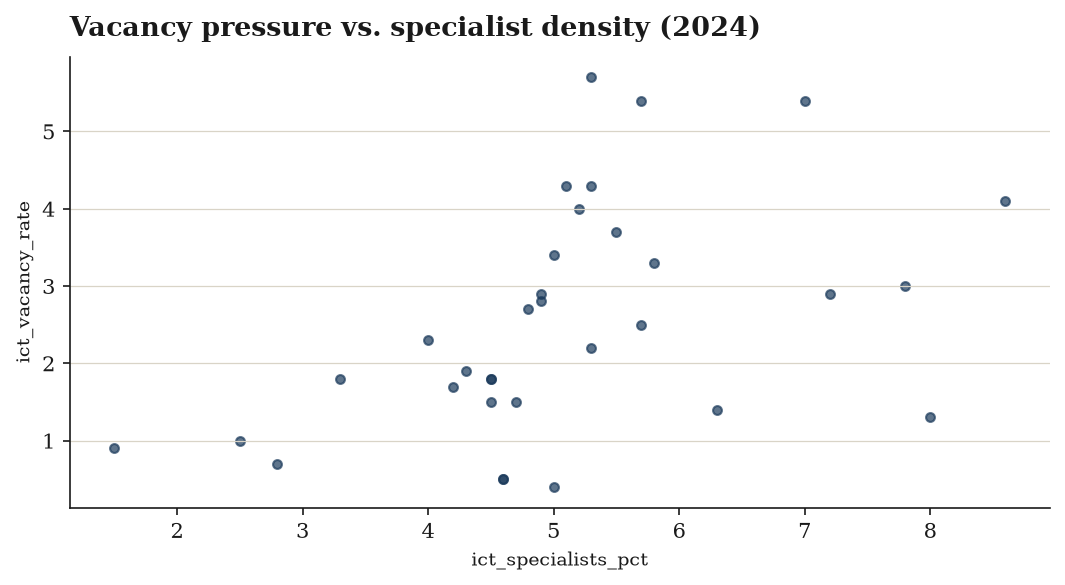
- ICT hiring pressure consistently exceeds the whole economy. Mean ICT vacancy rate is 2.698% vs 2.004% for all sectors; median 2.6% vs 1.9%. The
vacancy_premiumaverages 1.367 (median 1.333), andis_tighter_than_economyis True in 275 of 412 rows (~67%). - Premium dispersion is wide. Values run from 0.2 (ICT far looser than the local economy) to 3.8 — a near-19× spread, signalling that "tech is always tight" does not hold universally.
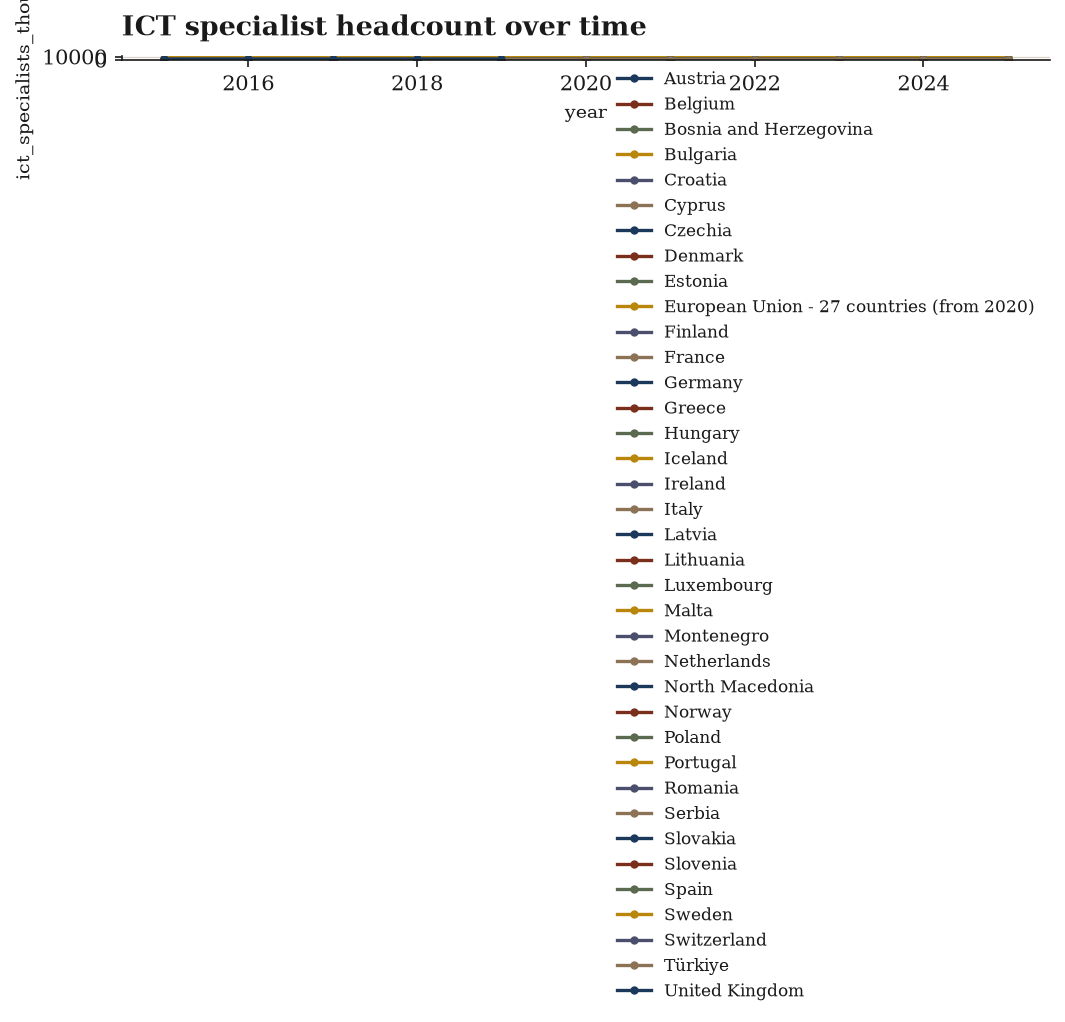
- Specialist headcount is extremely skewed.
ict_specialists_thousandshas mean 527.2 against median 158.1, max 10,450 and min 4.5 — a classic large-vs-small-member-state split.specialist_share_of_eu_pctreinforces this: median 0.83% but max 47.54%, i.e. one geography accounts for nearly half the pool in some year. - Specialist intensity is more evenly spread than headcount:
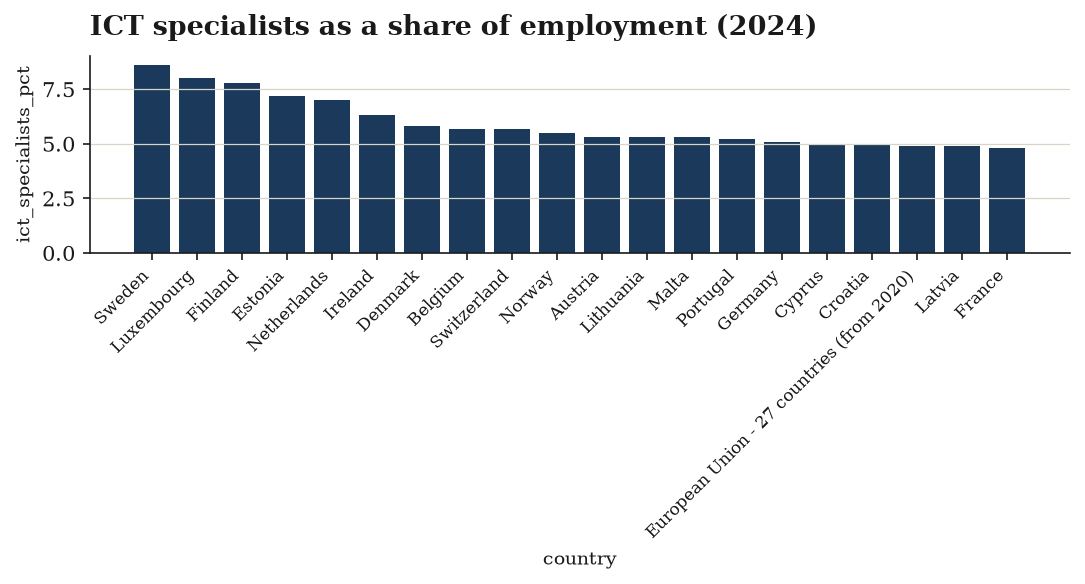
ict_specialists_pctmean 4.28 ≈ median 4.3, range 1.2–8.9. - Growth is positive but volatile. 3-year CAGR averages 5.617% (median 5.216%), yet ranges from −5.308% to +24.45% — genuine contractions coexist with explosive expansion.
- Tightness classes skew hot: tight (137) + overheated (66) = 203 rows vs slack (58) and balanced (115).
Charts included
Data preview
| geo_code | country | year | ict_vacancy_rate | all_sector_vacancy_rate | ict_specialists_pct | ict_specialists_thousands |
|---|---|---|---|---|---|---|
| AT | Austria | 2015 | 2.6 | 1.9 | 4.0 | 166.6 |
| AT | Austria | 2016 | 3.3 | 2.1 | 4.2 | 178.6 |
| AT | Austria | 2017 | 4.1 | 2.7 | 4.4 | 187.8 |
| AT | Austria | 2018 | 5.6 | 3.2 | 4.5 | 191.8 |
| AT | Austria | 2019 | 5.7 | 3.4 | 4.3 | 184.6 |
| AT | Austria | 2020 | 4.6 | 2.8 | 4.5 | 193.5 |
| AT | Austria | 2021 | 7.0 | 3.9 | 4.5 | 192.5 |
| AT | Austria | 2022 | 7.0 | 5.3 | 5.0 | 220.6 |
First 8 of 412 rows and 7 further columns. The download carries every row and column.
Every column, defined
geo_code— Eurostat geo code (country or aggregate)countryyearict_vacancy_rate(%) — job vacancy rate, NACE J (information & communication)all_sector_vacancy_rate(%) — job vacancy rate, whole business economy (NACE B-S)ict_specialists_pct(%) — employed ICT specialists as a share of total employmentict_specialists_thousands(thousand persons)vacancy_premium— ICT vacancy rate ÷ all-sector vacancy rate — >1 means tech hiring is tighter than the wider economyspecialist_growth_cagr_3y(%) — 3-year CAGR of the ICT specialist headcountspecialist_share_of_eu_pct(%) — country share of the cohort's ICT specialist headcount that yeartalent_pool_zscore— standardised specialist density across the cohortmarket_tightness_score— 0-100 composite of vacancy pressure and specialist scarcitytightness_class— overheated | tight | balanced | slackis_tighter_than_economy
Inside the PDF brief
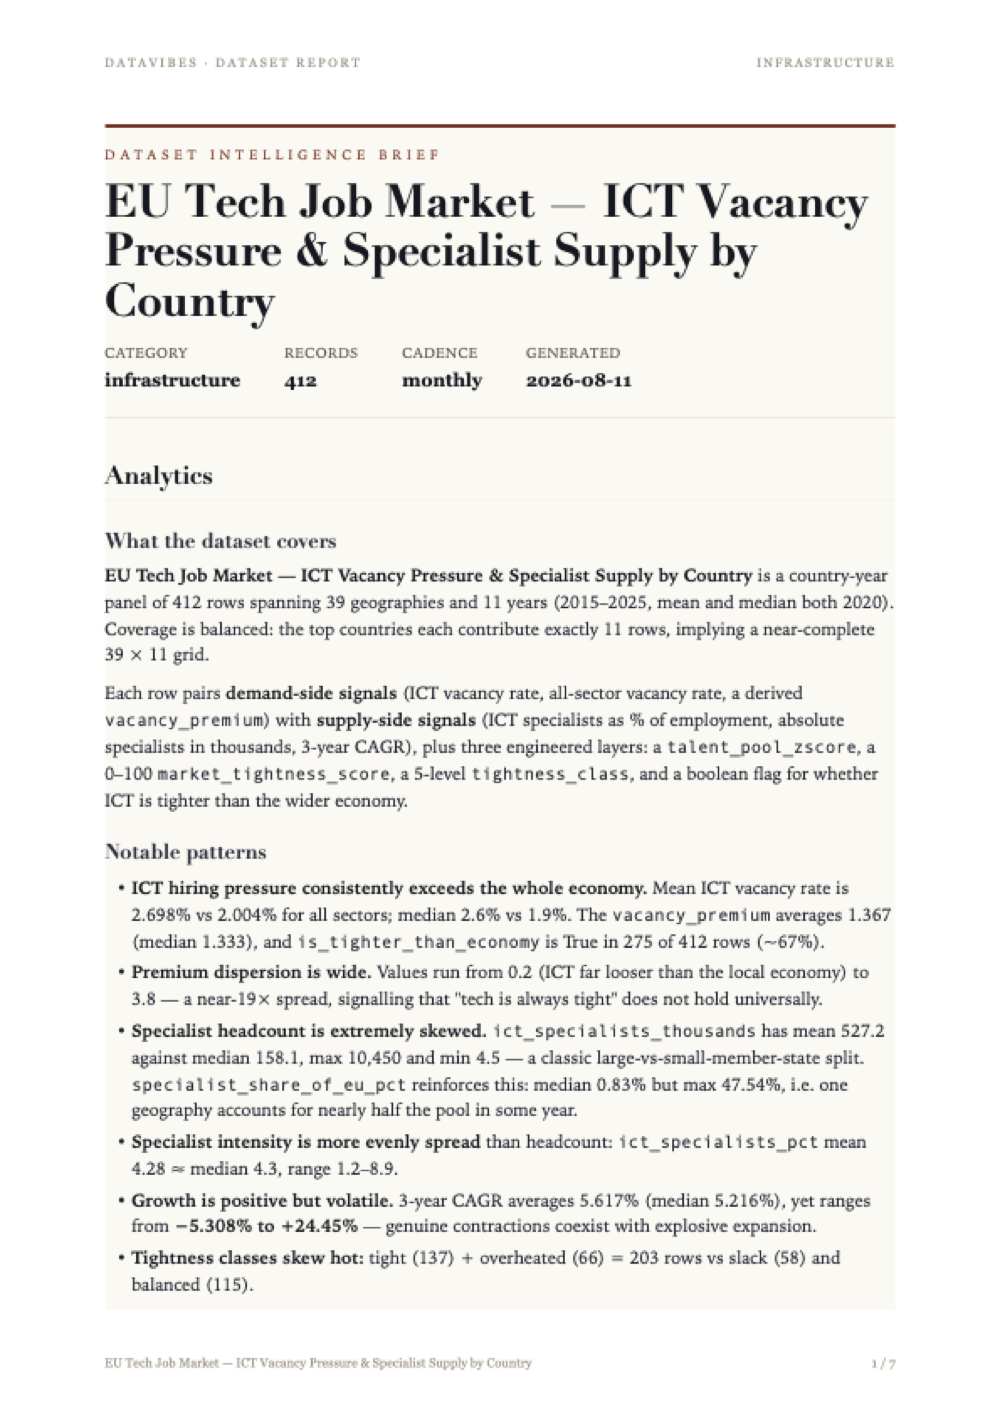
Every issue ships with a written brief: what the data covers, the patterns worth acting on, and the statistical work behind each derived column — with the limitations stated plainly rather than buried.
The page shown here is the first of the full report included in your download. Tap it to read at full size.
Method and limitations
Overview
The dataset assembles country-year observations of ICT labour market pressure across 39 European geographies (geo_code / country) for the years 2015–2025, yielding 412 rows. Each geography appears 11 times, consistent with a complete country × year grid. On top of the raw indicators — ICT job vacancy rate, all-sector vacancy rate, ICT specialists as a share of employment, and ICT specialists in absolute thousands — a sequence of derived ratios, growth rates, shares, standardised scores, a composite index, and a categorical classification were computed.
Processing pipeline
- Normalize — harmonisation of incoming fields prior to any relational work.
- Join on the composite key
['geo_code', 'year']— merging the vacancy-side and specialist-supply-side sources into a single country-year record. - Sort by
['geo_code', 'year']— establishing the within-country chronological ordering required for the subsequent time-dependent derivation.
Derived statistics
Vacancy premium (ratio)
vacancy_premium = ratio(ict_vacancy_rate, all_sector_vacancy_rate)
A per-row relative measure expressing ICT vacancy intensity as a multiple of the whole-economy vacancy rate. It is defined only where both inputs exist, hence 361/412 non-null — the same coverage as all_sector_vacancy_rate, which is the binding constraint (ict_vacancy_rate has 376). Observed range 0.2–3.8, mean 1.367, median 1.333; the near-coincidence of mean and median suggests only mild skew. Values above 1 indicate ICT demand pressure exceeding the general labour market.
Three-year specialist growth (CAGR)
specialist_growth_cagr_3y = cagr(ict_specialists_thousands, years=3), partitioned by: ['geo_code']
A compound annual growth rate computed within each country's own time series over a three-year window, expressed in percent. Coverage drops sharply to 278/412 non-null — the expected consequence of a rolling window: the earliest years of each country series have no three-year lag base, and any gap in ict_specialists_thousands propagates into the window. Range −5.31% to 24.45%, mean 5.62%, median 5.22%, stdev 4.16 — mostly positive expansion with a right tail of fast-growing pools.
Share of EU specialist stock
specialist_share_of_eu_pct = share_of_total(ict_specialists_thousands), partitioned by: ['year']
Each country's absolute specialist headcount expressed as a percentage of the annual cross-sectional total, so shares are comparable within a year and re-based each year. The distribution is extremely right-skewed: median 0.83% against a mean of 2.83%, maximum 47.54%, stdev 7.60. This mirrors the underlying ict_specialists_thousands (median 158.1 vs mean 527.2, max 10,450), reflecting the dominance of a few large economies in a set that also includes very small states.
Talent pool z-score
talent_pool_zscore = zscore(ict_specialists_pct)
Standardisation of the specialist employment share across the whole pooled dataset (no partition), converting percentage points into standard deviations from the pooled mean. The output confirms the transformation: mean ≈ 3.57e−20 (numerically zero) and stdev exactly 1, over the same 389 non-null rows as its input. Range −2.03 to +3.05, median +0.013 — approximately centred with a modestly longer upper tail.
Composite scoring
market_tightness_score = score(weights = {ict_vacancy_rate: 0.5, vacancy_premium: 0.3, ict_specialists_pct: 0.2}, scale = 100)
A weighted composite on a 0–100 scale combining absolute ICT vacancy pressure (50%), relative pressure versus the wider economy (30%), and specialist supply density (20%). The realised distribution spans 0 to 74.52 with mean 31.95, median 32.65 and stdev 14.52 — reasonably symmetric and occupying only the lower three-quarters of the nominal scale, so no observation approaches the theoretical maximum. Notably the score is 412/412 non-null, i.e. populated for every row even though all three of its inputs have missing values; the scoring step therefore does not propagate input nullity, and low scores (including the minimum of 0) cannot be distinguished from data-poor rows on the basis of the score alone.
Classification and flagging
Tightness class — classify on ict_vacancy_rate with left-closed lower bounds: ≥ 4.0 → overheated; ≥ 2.5 → tight; ≥ 1.2 → balanced; otherwise slack; default = unknown. The resulting frequencies are tight (137), balanced (115), overheated (66), slack (58), unknown (36). The 36 unknown rows correspond exactly to the 36 missing ict_vacancy_rate values (412 − 376 = 36), so the default label functions as an explicit missing-data category rather than a substantive class. The four substantive bins cover 376 rows.
Tighter-than-economy flag — flag set where vacancy_premium > 1.0, giving True 275, False 137. Since vacancy_premium is non-null for only 361 rows, the 51 rows lacking a premium must fall into the False group; False therefore conflates "measured but not tighter" with "not measurable", and the True count (275) is the only unambiguous quantity.
Validate — a terminal integrity check closing the pipeline.
Limitations
- Missingness is uneven and cascades. Coverage ranges from 412 (identifiers, score, class, flag) down to 278 (
specialist_growth_cagr_3y). Any cross-column comparison, correlation or ranking is effectively performed on the intersection of available fields, which is smaller than the nominal 412 rows and is not evenly distributed across countries or years. - Boolean and score fields hide nulls. Both
market_tightness_scoreandis_tighter_than_economyare fully populated despite incomplete inputs. Treating a score of 0 as genuine slackness, orFalseas evidence of no premium, will misattribute missing data as substantive signal. - Rolling-window bias in the CAGR. The three-year growth rate systematically excludes early-period observations and any country-year adjacent to a gap. Aggregate growth statistics (mean 5.62%) are thus conditioned on the subset of country-years with three consecutive prior observations, not on the full panel.
- Skew in share and headcount measures.
specialist_share_of_eu_pctandict_specialists_thousandsare dominated by a handful of large economies (max share 47.54%). Means are unrepresentative for these fields; medians and rank-based summaries are more appropriate. - Pooled standardisation mixes countries and years.
talent_pool_zscoreis computed over the whole dataset rather than within year, so it blends cross-country dispersion with any common time trend inict_specialists_pct. It is not a clean within-year relative position. - Composite weights are imposed, not estimated. The 0.5 / 0.3 / 0.2 weighting is an analyst choice with no stated empirical justification. The score also double-counts vacancy information, since
vacancy_premiumis itself a function ofict_vacancy_rate; the two weighted components are mechanically correlated, giving vacancy pressure more than its nominal 50% influence. - Composite mixes construct directions. Vacancy pressure and specialist supply density enter the same index additively, so a high score can arise from scarce labour or from an abundant specialist workforce. The score is not interpretable as tightness alone without decomposition.
- Threshold sensitivity. The class cut-points (4.0, 2.5, 1.2) and the flag threshold (1.0) are fixed constants applied uniformly across countries and years. Given that
ict_vacancy_ratehas a stdev of 1.499, small measurement differences can move an observation between adjacent classes; class counts should not be read as stable. - No causal or structural interpretation. All quantities are descriptive derivations of reported rates and headcounts. Definitional differences in vacancy and ICT-specialist measurement across the 39 geographies, and the units mixing percentages, ratios and thousands of persons, are not addressed by any step in the pipeline beyond the initial normalisation.
- The 2025 endpoint and the join. The panel extends to 2025; the completeness of the most recent year relative to earlier years cannot be assessed from the profile alone, and the join's match rate is not reported — only that all 39 countries have exactly 11 rows after processing.
Provenance
Source: Eurostat: jvs_a_rate_r2 (job vacancy rate by NACE), isoc_sks_itspt (employed ICT specialists)
Licence: Eurostat open data — free reuse with attribution (CC-BY-4.0 equivalent)
Collected and derived with datavibes, a deterministic pipeline: the same config and timestamp always reproduce the same file.