- Records
- 1,249
- Columns
- 9
- Data through
- 2026-07-07
- Source updates
- daily
- Issue collected
- 2026-07-07
- Licence
- see provenance
What you get
- 1,249-row CSV9 typed columns, ready for pandas, Excel or SQL
- PDF intelligence briefthe analytics read and methodology, written against this issue
- 3 chartspublication-ready PNGs of the headline relationships
- analytics.md + statistics.mdthe same findings as text, for quoting and reuse
- Versioned archiveevery past issue stays downloadable, so you can build a time series
- API accesspull the data with a scoped key instead of clicking download
What the current issue shows
This dataset provides a price/performance matrix for cloud compute instances, covering 1,249 unique instance types from two providers: AWS (us‑east‑1) and Azure (eastus). The overwhelming majority of rows belong to AWS (1,219) with only 30 Azure instances, making this a de‑facto AWS‑centric resource. Every row represents a distinct instance_type, and no instance is duplicated across regions.
Notable patterns
- vCPU and memory are highly right‑skewed. vCPU ranges from 1 to 896 (median 16, mean 50) and memory from 0.5 GiB to 32,770 GiB (median 96 GiB, mean 409 GiB). A small number of extremely large instances drive the means far above the medians.
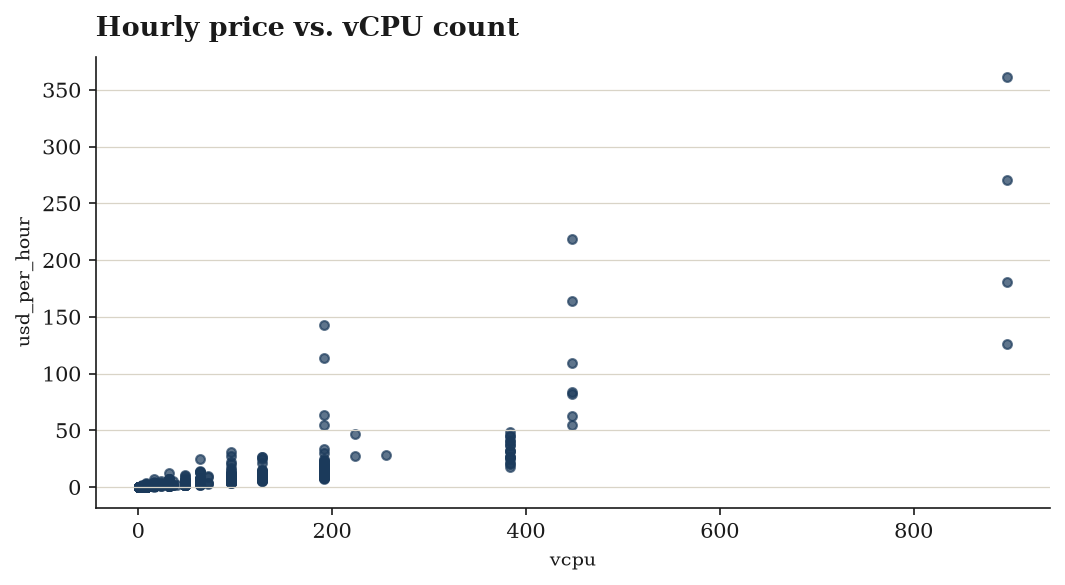
- Hourly cost follows the same shape: min $0.0042, max $361.00, median $1.455, mean $5.135, with a standard deviation of 18.42.
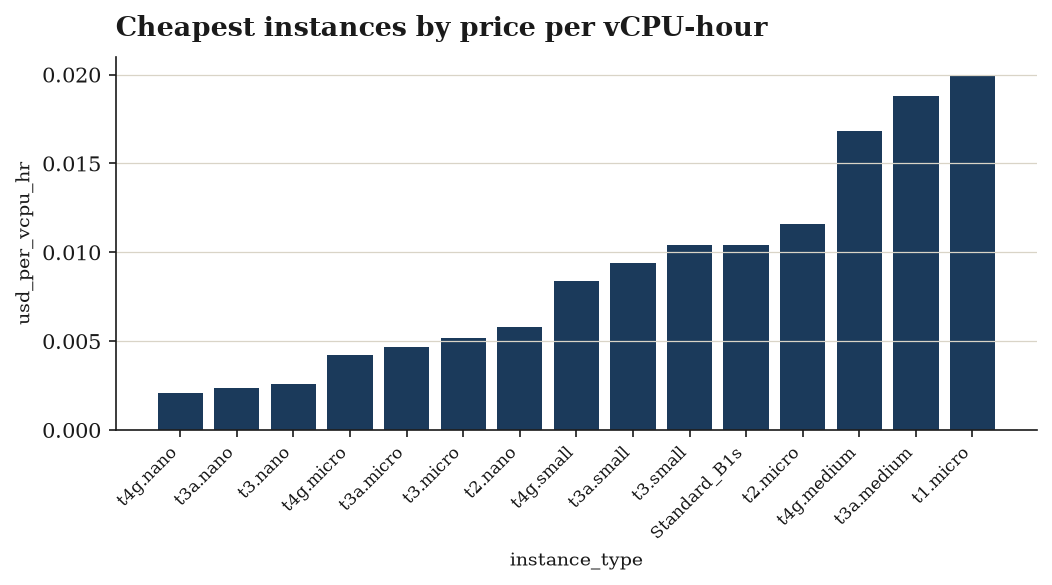
- Per‑resource pricing efficiency is tightly clustered. Cost per vCPU‑hour ranges from $0.0021 to $0.7418, with a mean of $0.078 and median $0.065, indicating most instances are cost‑efficient on a per‑core basis. Cost per GiB‑hour varies from $0.0052 to $0.0765 (mean $0.0166, median $0.0144) — a compressed spread relative to the vast memory range.
- The
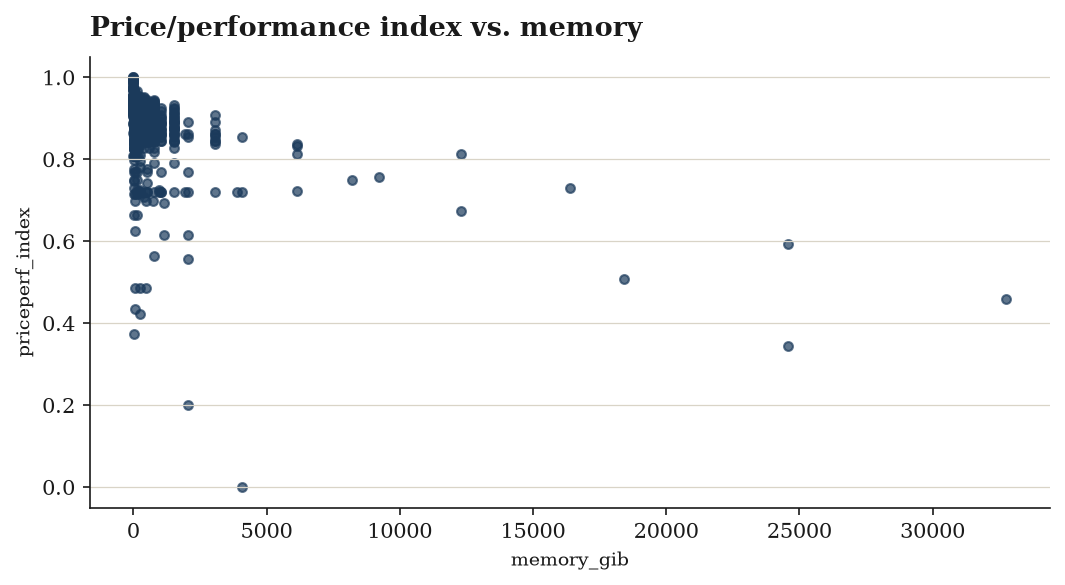
priceperf_index(0–1) is heavily concentrated near the top: mean 0.897, median 0.915, standard deviation 0.074. The majority of instances score above 0.9, but a right‑tail stretch to 0 reveals a handful of zero‑performance outliers.
Key outliers
- A single (or very few) instance(s) responsible for the 896 vCPU / 32,770 GiB memory and $361/hr cost, almost certainly an AWS bare‑metal high‑memory type.
- The 30 Azure eastus entries represent a limited but distinct subset, which may exhibit different cost‑per‑performance characteristics from the AWS bulk.
- priceperf_index min of 0 points to instances with no measurable or extremely poor performance in the underlying benchmark; these are isolated and may merit exclusion for typical analysis.
Who would find this valuable
Cloud architects, FinOps practitioners, and procurement teams evaluating AWS compute options in us‑east‑1 will get the most value. The large number of distinct instance types allows detailed exploration of price/performance trade‑offs across the entire AWS portfolio. The dataset is less suitable for cross‑cloud benchmarking due to the minimal Azure representation (30 rows) and single‑region nature. It is ideal for building cost‑optimization models, instance selection tools, or benchmarking frameworks that rely on normalized performance indices and per‑resource cost metrics.
Charts included
Data preview
| provider | region | instance_type | vcpu | memory_gib | usd_per_hour | usd_per_vcpu_hr |
|---|---|---|---|---|---|---|
| aws | us-east-1 | a1.2xlarge | 8.0 | 16.0 | 0.204 | 0.0255 |
| aws | us-east-1 | a1.4xlarge | 16.0 | 32.0 | 0.408 | 0.0255 |
| aws | us-east-1 | a1.large | 2.0 | 4.0 | 0.051 | 0.0255 |
| aws | us-east-1 | a1.medium | 1.0 | 2.0 | 0.0255 | 0.0255 |
| aws | us-east-1 | a1.xlarge | 4.0 | 8.0 | 0.102 | 0.0255 |
| aws | us-east-1 | c1.medium | 2.0 | 1.7 | 0.13 | 0.065 |
| aws | us-east-1 | c1.xlarge | 8.0 | 7.0 | 0.52 | 0.065 |
| aws | us-east-1 | c3.2xlarge | 8.0 | 15.0 | 0.42 | 0.0525 |
First 8 of 1,249 rows and 2 further columns. The download carries every row and column.
Every column, defined
providerregioninstance_typevcpu(count)memory_gib(GiB)usd_per_hour(USD/hr)usd_per_vcpu_hr(USD/hr)usd_per_gib_hr(USD/hr)priceperf_index— 0-1 min-max price/perf (higher = cheaper per vCPU)
Inside the PDF brief
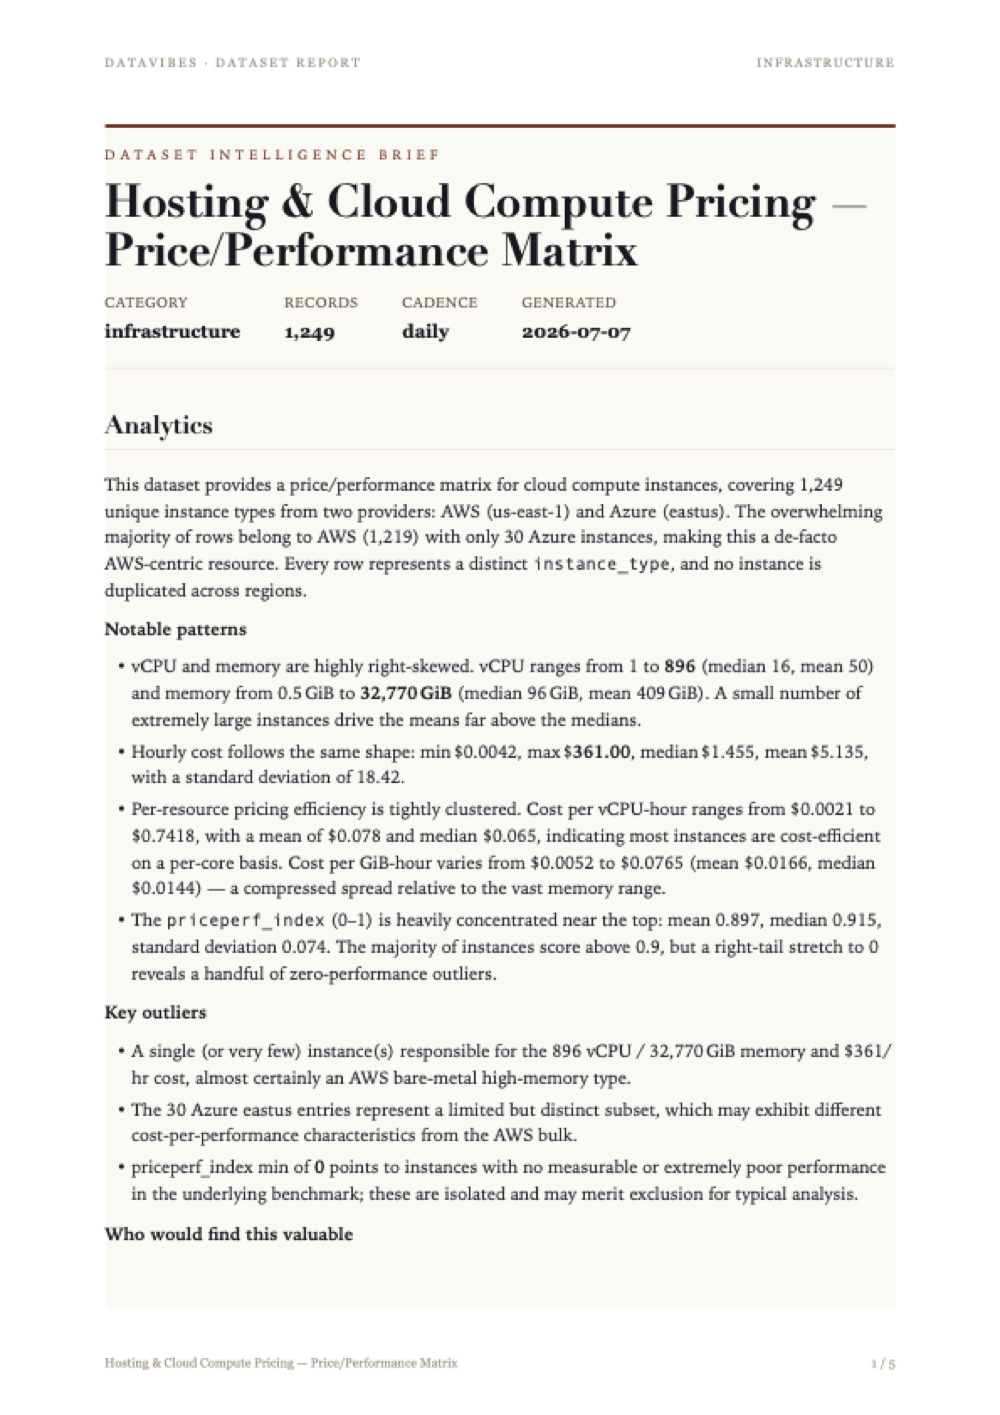
Every issue ships with a written brief: what the data covers, the patterns worth acting on, and the statistical work behind each derived column — with the limitations stated plainly rather than buried.
The page shown here is the first of the full report included in your download. Tap it to read at full size.
Method and limitations
Derivations
Three new metrics were computed from the raw instance attributes to quantify cost efficiency:
Unit cost per vCPU-hour
usd_per_vcpu_hr = usd_per_hour / vcpu
Represents the hourly cost of a single virtual CPU, allowing price-normalized comparisons across instance sizes.Unit cost per GiB-hour
usd_per_gib_hr = usd_per_hour / memory_gib
Analogous cost per unit of memory, enabling memory‑centric price analysis.Price‑performance index
priceperf_index = minmax_normalize(usd_per_vcpu_hr, invert=true)
A min‑max normalization that mapsusd_per_vcpu_hronto the interval [0, 1] such that the cheapest instance (lowest vCPU cost) receives a score of 1, and the most expensive receives 0. The inversion makes higher values indicate better cost efficiency. The formula applied:
[ \text{index} = 1 - \frac{x - \min}{\max - \min} = \frac{\max - x}{\max - \min} ]
Aggregations and Metrics
No explicit grouping or aggregation step was performed. The statistical profile provided after validation gives descriptive statistics for all numeric columns:
- Counts confirm no missing values (1249 non‑null for every column).
- Central tendency and spread – mean, median, and standard deviation – summarize distributions:
- Original attributes (
vcpu,memory_gib,usd_per_hour) show heavy right‑skew (mean > median, high variability). - The derived
priceperf_indexhas mean 0.8974 and median 0.9146 with a moderate standard deviation of 0.07392, indicating that most instances achieve a high index (low vCPU cost), with a long tail of less cost‑efficient offerings pulling the mean downward. - The minimum (0) and maximum (1) of
priceperf_indexconfirm the min‑max range. - The
usd_per_vcpu_hrdistribution shows a similar skew (min 0.0021, max 0.7418, median 0.06526), which directly influences the index.
The deduplication step on the composite key (provider, region, instance_type) ensures each unique instance configuration appears once. The preceding normalize step (likely string normalization for consistency) and subsequent validate action rely on these profile statistics to verify data integrity and derivation correctness.
Limitations
Single resource focus
The price‑performance index is based solely on vCPU cost (usd_per_vcpu_hr). It ignores memory, network, storage, or other performance dimensions. A low vCPU cost does not guarantee overall cost‑effectiveness.Sensitivity of min‑max normalization
Min‑max scaling is highly influenced by extreme values. The maximumusd_per_vcpu_hr(0.7418) is more than 11 times the mean (0.0780), which compresses the majority of instances into a narrow band near the index’s upper bound (as reflected by the high median). A single price outlier can systematically distort the entire index.Linear inversion assumption
The inversion assumes that price‑performance value is linear with respect to the normalized cost. In practice, user utility may not scale linearly, and small absolute cost differences near the extremes can have disproportionate effects on the index.Data imbalance and limited coverage
Only two providers (AWS: 1219 instances, Azure: 30) and two regions are represented. The statistical summaries are dominated by AWS. Consequently, the derived metrics and the index cannot be generalized across cloud providers or geographies.Opaque initial normalization
The exact operation of the firstnormalizestep is unspecified (e.g., text casing, unit conversion, or numerical scaling). If it involved any numerical transformations prior to the derivations, it would affect the resulting ratios and the index, but the impact cannot be assessed from the given information.Deduplication trade‑off
Deduplication onprovider,region,instance_typemay discard legitimate records that differ in other attributes (e.g., operating system, pricing model). The assumption that each key uniquely identifies a configuration is plausible but not guaranteed.
Provenance
Source: AWS Price List; Azure Retail Prices API
Licence: Public vendor price lists (informational)
Collected and derived with datavibes, a deterministic pipeline: the same config and timestamp always reproduce the same file.