- Records
- 5,692
- Columns
- 7
- Data through
- 2022
- Source updates
- annual
- Issue collected
- 2026-07-07
- Licence
- CC-BY-4.0
What you get
- 5,692-row CSV7 typed columns, ready for pandas, Excel or SQL
- PDF intelligence briefthe analytics read and methodology, written against this issue
- 3 chartspublication-ready PNGs of the headline relationships
- analytics.md + statistics.mdthe same findings as text, for quoting and reuse
- Versioned archiveevery past issue stays downloadable, so you can build a time series
- API accesspull the data with a scoped key instead of clicking download
What the current issue shows
This dataset provides a country-year panel of renewable energy adoption and transition speed for 257 territories from 2000 to 2022. It contains 5,692 rows covering two share metrics (renewable electricity as a percentage of total electricity, and renewable final energy consumption as a percentage), a 5-year compound annual growth rate (CAGR) for renewables, and a composite transition score. All values are numeric except country name and ISO3 code.
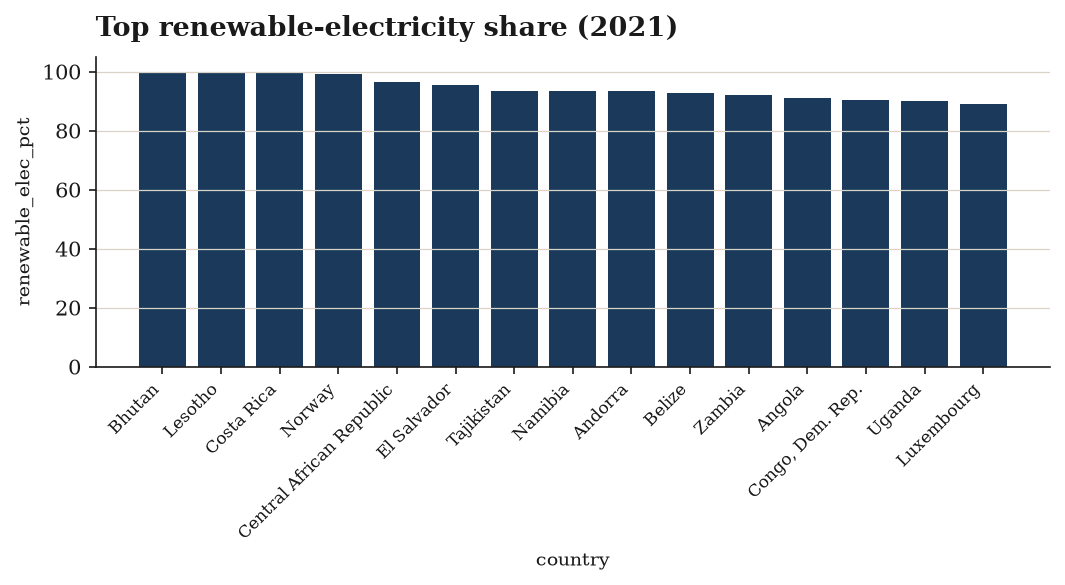
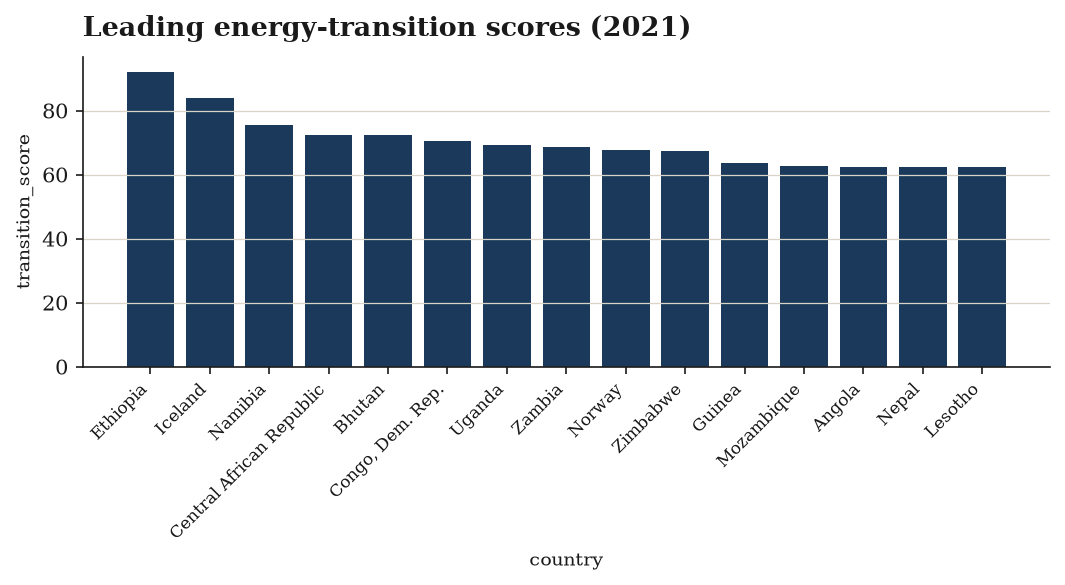
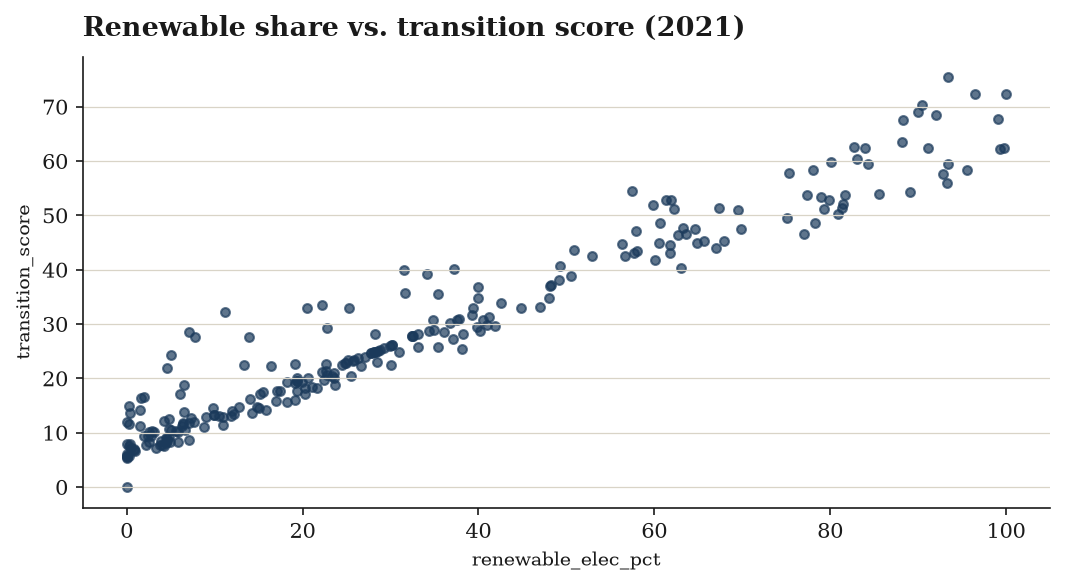
Notable patterns - The panel is not fully balanced across all 23 years; although some countries like Afghanistan or Andorra appear for all 23 years, the total row count (5,692) falls short of a perfect 257×23 grid, indicating missing country-year records. - Renewable electricity and final energy shares are highly right‑skewed. The mean for electricity share is 29.5%, but the median is only 19.7%, with a standard deviation nearly equal to the mean (29.7). Final energy share behaves similarly (mean 30.3%, median 20%, stdev 28.8). This suggests that while a handful of countries have reached near‑100% renewable electricity or 98.3% in final energy, most nations remain below 20%. - The transition score, which is present for every row, mirrors this pattern: mean 27.9, median 21.5, and stdev 22.6. The long tail implies a cluster of countries scoring very low and a small group scoring much higher. - The 5‑year CAGR is missing for roughly one‑third of rows (1,933 nulls; often the earliest years cannot have a 5‑year lookback). Where present, its distribution is extreme: median growth is just 1.1%, yet the mean is 6.5%, driven by outliers. The maximum CAGR is 433%, indicative of either explosive growth from a very low base or potential data anomalies. A minimum of ‑100% signals complete collapse of the renewable base within a 5‑year window.
Who would find this dataset valuable - Energy policy analysts and researchers studying global energy transitions, especially those needing country‑level time series to benchmark progress. - Climate modelers and scenario builders requiring historical renewable shares for calibration. - Investment analysts screening markets for rapid renewable growth (using CAGR) or high current shares. - Journalists and data‑driven storytellers seeking to highlight leaders, laggards, and transition outliers.
Charts included
Data preview
| country | iso3 | year | renewable_elec_pct | renewable_fec_pct | renewable_cagr_5y | transition_score |
|---|---|---|---|---|---|---|
| Aruba | ABW | 2000 | 0.0 | 0.2 | 0.05813108559802356 | |
| Aruba | ABW | 2001 | 0.0 | 0.2 | 0.05813108559802356 | |
| Aruba | ABW | 2002 | 0.0 | 0.2 | 0.05813108559802356 | |
| Aruba | ABW | 2003 | 0.0 | 0.2 | 0.05813108559802356 | |
| Aruba | ABW | 2004 | 0.0 | 0.2 | 0.05813108559802356 | |
| Aruba | ABW | 2005 | 0.0 | 0.2 | 0.05813108559802356 | |
| Aruba | ABW | 2006 | 0.0 | 0.2 | 0.05813108559802356 | |
| Aruba | ABW | 2007 | 0.0 | 0.2 | 0.05813108559802356 |
First 8 of 5,692 rows. The download carries every row and column.
Every column, defined
countryiso3yearrenewable_elec_pct(%) — renewable electricity output sharerenewable_fec_pct(%) — renewable % of final energy consumptionrenewable_cagr_5y(%) — 5y CAGR of renewable electricity sharetransition_score— 0-100 composite transition index
Inside the PDF brief
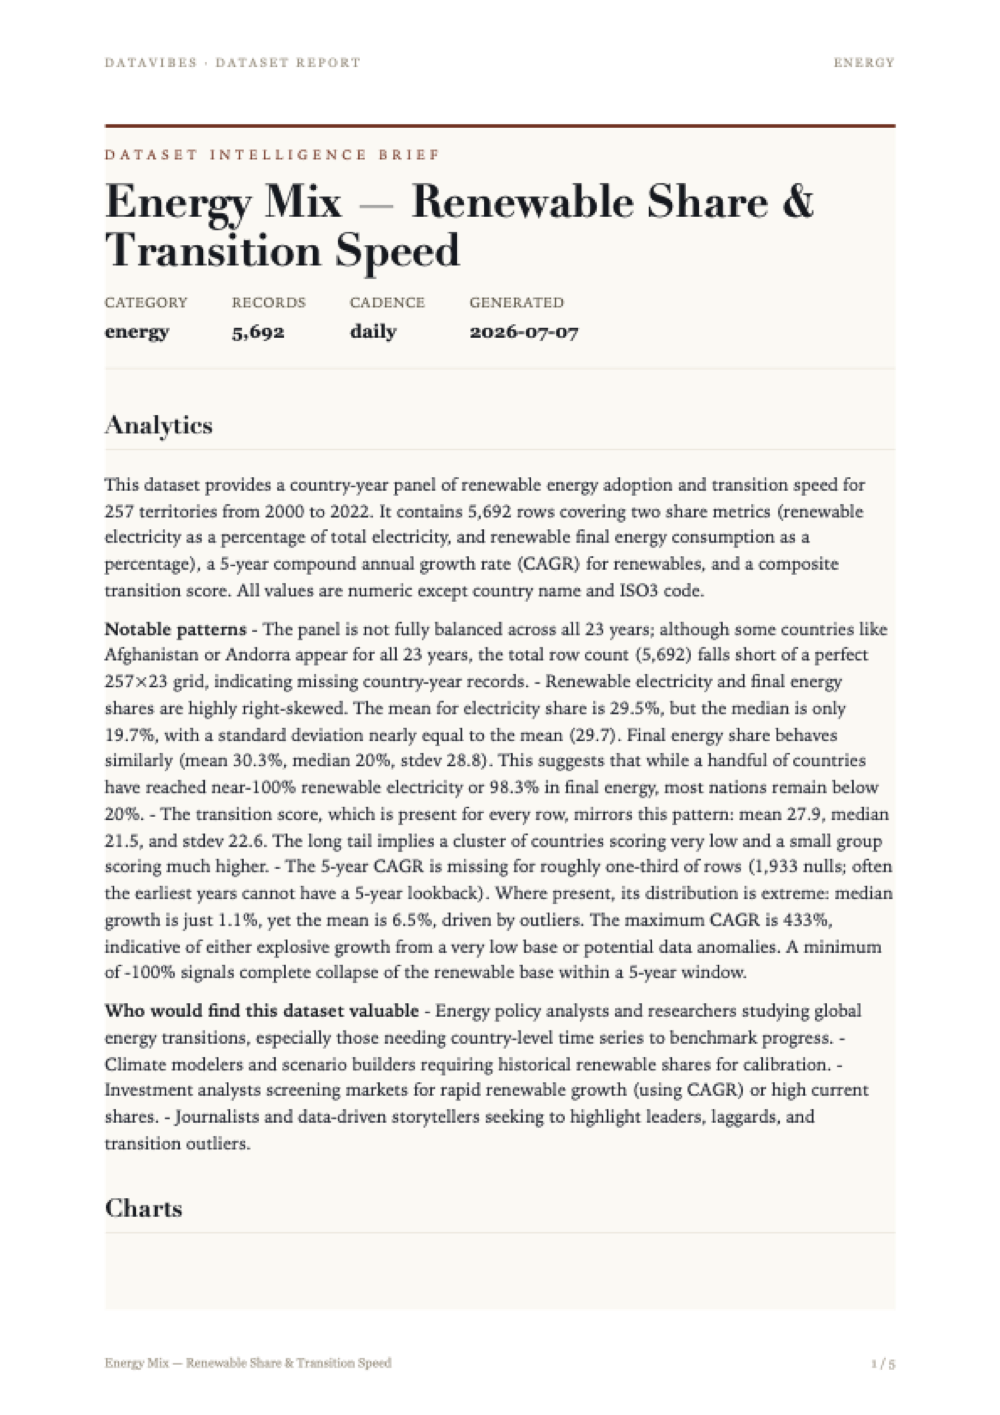
Every issue ships with a written brief: what the data covers, the patterns worth acting on, and the statistical work behind each derived column — with the limitations stated plainly rather than buried.
The page shown here is the first of the full report included in your download. Tap it to read at full size.
Method and limitations
Derivations
The column renewable_cagr_5y is derived from the renewable_elec_pct time series. For each country (grouped by iso3), a 5-year compound annual growth rate (CAGR) is computed:
[ \text{CAGR}{t} = \left( \frac{\text{renewable_elec_pct}{t}}{\text{renewable_elec_pct}_{t-5}} \right)^{\frac{1}{5}} - 1 ]
The result is expressed as a percentage. This derivation measures the annualised rate of change in the share of electricity from renewables over the previous five years, capturing the speed of energy transition in the power sector. It is computed after the normalize and join steps, relying on a complete 5-year history per country, which leads to missing values for the earliest years (2000‑2004) and any gaps in the underlying electricity share data.
Aggregations
- CAGR calculation implicitly aggregates five annual observations into a single rate of change for each country-year.
- The profile statistics (mean, median, standard deviation, min, max) reported for each numeric column represent aggregations over all available rows, providing an overall picture of central tendency, dispersion, and range across all countries and years (2000‑2022).
- The
joinstep on['iso3', 'year']may bring in auxiliary data and merges records at the country-year level, but no further explicit aggregations are described in the processing steps.
Metrics
The column transition_score is a composite metric derived as a weighted sum of three normalised indicators:
renewable_elec_pct– share of electricity from renewables (weight = 0.5)renewable_cagr_5y– 5-year CAGR of that share (weight = 0.3)renewable_fec_pct– share of total final energy consumption from renewables (weight = 0.2)
The scoring formula is applied after the indicators have been normalised (step normalize) to place them on a common scale. The final score is then scaled to a 0‑100 range (parameter scale: 100). The weights reflect a prioritisation of current electricity‑sector penetration as the primary driver (0.5), followed by recent growth momentum (0.3) and the broader whole‑economy renewable share (0.2). The metric thus synthesises both the level and the direction of a country’s energy system transformation into a single figure, with higher scores indicating a faster or more advanced transition.
Limitations
- Missing data –
renewable_elec_pcthas 301 missing values;renewable_fec_pcthas 87;renewable_cagr_5yhas 1,933 missing, largely because a 5-year lookback is impossible for 2000–2004 or when upstream data are absent. The derived metrics are accordingly unavailable for many early years and some country‑years. - CAGR sensitivity – The CAGR metric is computed from ratios; it can produce extreme or undefined values when the base-year share is zero or very small (the observed minimum of -100% likely reflects a decline to zero, while a maximum of 433% indicates a very low starting point). This volatility can distort the
transition_score, especially in therenewable_cagr_5ycomponent. - Subjective scoring weights – The choice of weights (0.5, 0.3, 0.2) is fixed and external to the data. The metric’s interpretation depends entirely on this weighting scheme and may not reflect region-specific transition priorities.
- Normalisation assumptions – The
normalizestep (method unspecified) assumes the input variables can be mapped to a common scale; if outliers or skewed distributions are present, the normalised values may compress or stretch the scoring range in ways that affect comparability. - Limited temporal depth – Data span only 2000‑2022. Longer-term trends, pre‑2000 baselines, or post‑2022 developments are not captured, limiting the assessment of sustained transition paths.
- Context omissions – The transition score considers only renewable shares and recent electricity growth. It does not incorporate absolute energy consumption, economy size, legacy infrastructure, grid flexibility, or other dimensions (e.g., energy efficiency, policy support) that influence the quality and sustainability of the transition.
Provenance
Source: World Bank Open Data (EG.ELC.RNEW.ZS, EG.FEC.RNEW.ZS)
Licence: World Bank Open Data CC-BY-4.0
Collected and derived with datavibes, a deterministic pipeline: the same config and timestamp always reproduce the same file.