- Records
- 2,920
- Columns
- 15
- Data through
- 2025-12-31
- Source updates
- daily
- Issue collected
- 2026-08-11
- Licence
- CC-BY-4.0
What you get
- 2,920-row CSV15 typed columns, ready for pandas, Excel or SQL
- PDF intelligence briefthe analytics read and methodology, written against this issue
- 4 chartspublication-ready PNGs of the headline relationships
- analytics.md + statistics.mdthe same findings as text, for quoting and reuse
- Versioned archiveevery past issue stays downloadable, so you can build a time series
- API accesspull the data with a scoped key instead of clicking download
What the current issue shows
- Renewable share is right-skewed: mean 41.61% vs. median 38.2%, with a wide range from 0.6% to 113.2%. Values above 100% indicate days where renewable generation exceeded domestic load — a real export/curtailment signal worth checking against your own definitions.
- Wind is the volatility driver. Wind onshore averages 13.85% but ranges to 81.9% with stdev 12.88, versus solar's tighter 14.13% mean, 52.2% max and stdev 9.92. Solar's minimum of 0 is consistent with winter or overcast days.
- Derived fields are well-formed.
renewable_anomalyhas mean ≈ 0 (-6.9e-16) and median -0.037, confirming a properly centred deviation measure with tails from -39.07pp to +53.53pp.weekday_seasonal_indexalso centres on 1.0 (range 0.916–1.085), implying a modest ~±8% weekday demand/supply effect. - Rolling windows have expected warm-up gaps:
renewable_7d_avgandrenewable_volatility_7deach have 2,872 non-null of 2,920 — exactly 48 missing, i.e. 6 days × 8 countries. - Class balance:
mixeddominates at 1,406 rows (48%), followed bygreen-majority(752),fossil-dominant(589) and only 173green-dominantdays (5.9%) — a genuinely rare class for modelling. - Flags are consistent:
is_low_renewable_dayTrue = 589, matching thefossil-dominantcount exactly.is_variability_spikefires on 425 days (14.6%). - Dispatchable gap averages 13.63% (max 52.2%), and variable share averages 27.98% (max 86.8%) — useful stress-test bounds.
Charts included
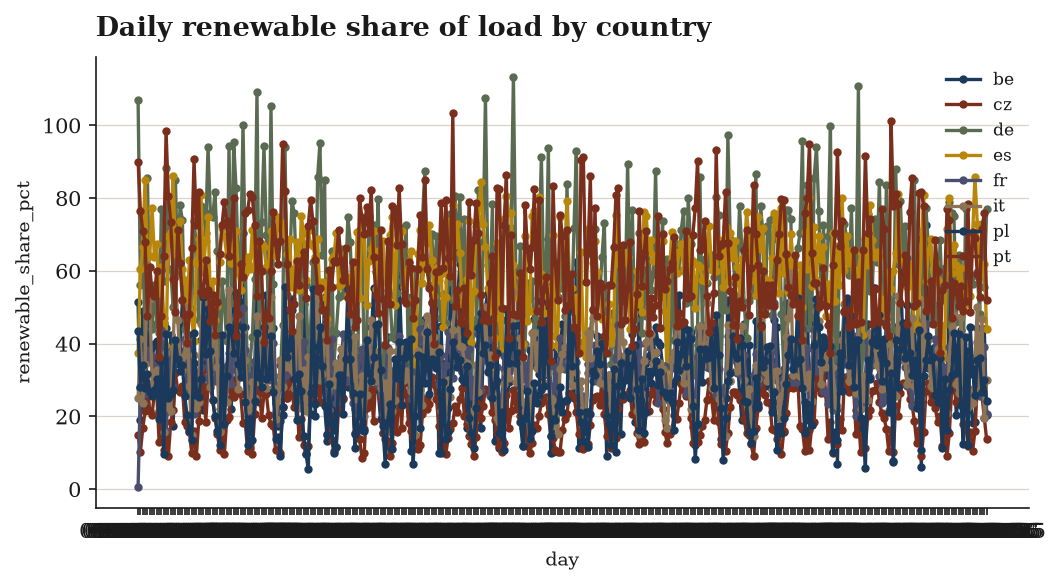
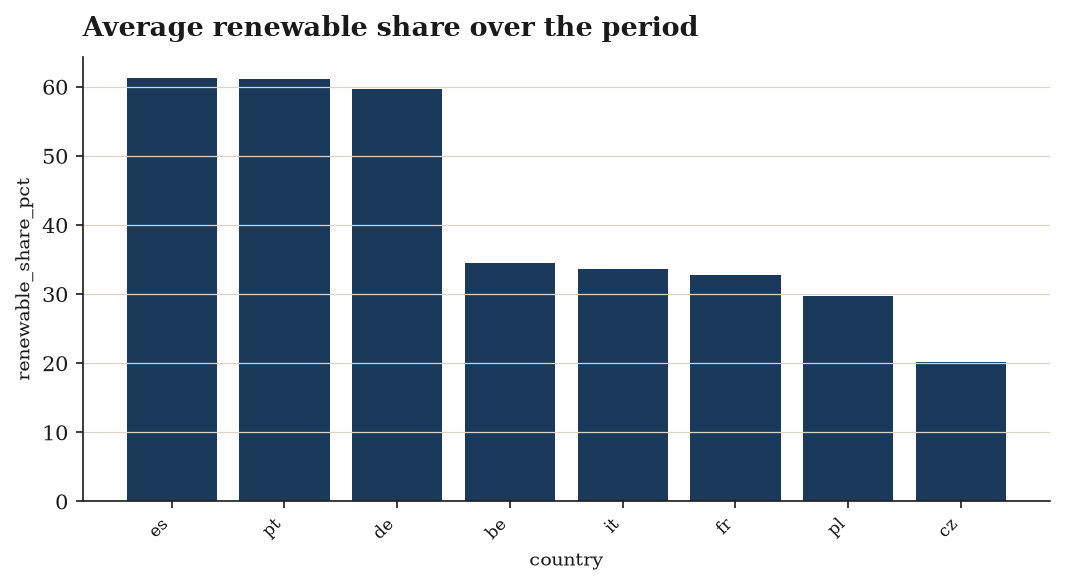
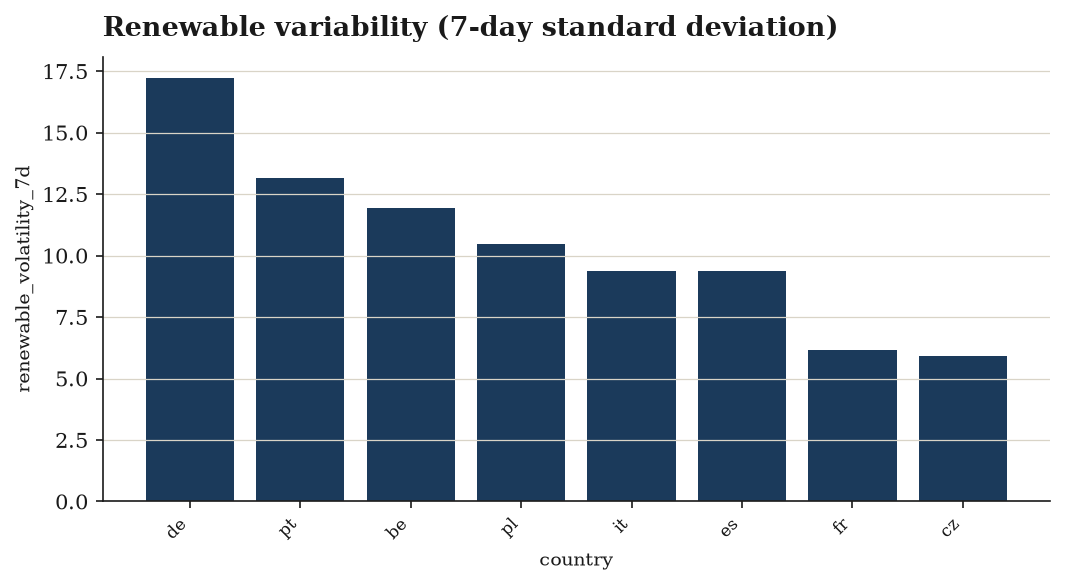
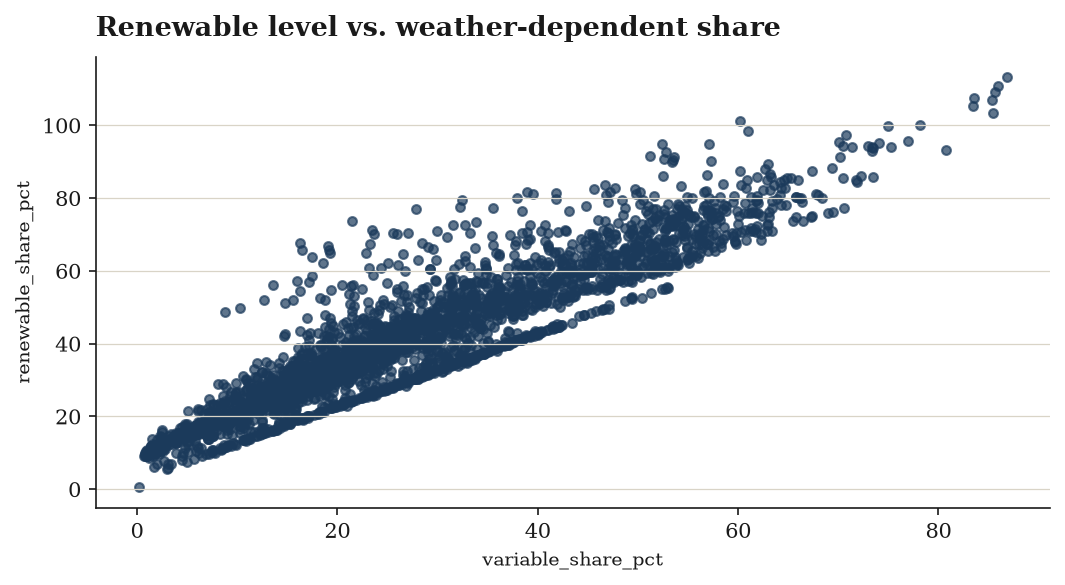
Data preview
| country | day | renewable_share_pct | solar_share_pct | wind_onshore_share_pct | renewable_7d_avg | renewable_anomaly |
|---|---|---|---|---|---|---|
| be | 01.01.2026 | 51.5 | 1.2 | 21.9 | 16.93013698630137 | |
| be | 01.02.2026 | 19.0 | 3.6 | 6.6 | -15.56986301369863 | |
| be | 01.03.2026 | 49.1 | 13.4 | 14.9 | 14.530136986301372 | |
| be | 01.04.2026 | 22.5 | 17.8 | 0.9 | -12.06986301369863 | |
| be | 01.05.2026 | 50.1 | 34.0 | 8.2 | 15.530136986301372 | |
| be | 01.06.2026 | 38.7 | 26.6 | 2.4 | 4.130136986301373 | |
| be | 01.07.2026 | 35.9 | 26.5 | 2.6 | 38.114285714285714 | 1.330136986301369 |
| be | 01.08.2026 | 39.9 | 33.0 | 2.8 | 36.457142857142856 | 5.330136986301369 |
First 8 of 2,920 rows and 8 further columns. The download carries every row and column.
Every column, defined
country— ENTSO-E country codeday— calendar day, DD.MM.YYYY as publishedrenewable_share_pct(%) — daily average renewable share of loadsolar_share_pct(%) — daily average solar share of loadwind_onshore_share_pct(%) — daily average onshore wind share of loadrenewable_7d_avg(%) — trailing 7-day mean renewable sharerenewable_anomaly(pp) — deviation from the country's period mean, percentage pointsrenewable_volatility_7d(pp) — trailing 7-day standard deviation of the renewable shareweekday_seasonal_index— day-of-week seasonal index — 1.10 means that weekday runs 10% above the country averagevariable_share_pct(%) — solar + onshore wind — the weather-dependent portiondispatchable_gap_pct(%) — renewable share not covered by solar or onshore windgrid_greenness_score— 0-100 composite of renewable level and stabilitysupply_class— green-dominant | green-majority | mixed | fossil-dominantis_low_renewable_day— renewable share below 25% — a residual-load stress dayis_variability_spike— 7-day volatility above 15 percentage points
Inside the PDF brief
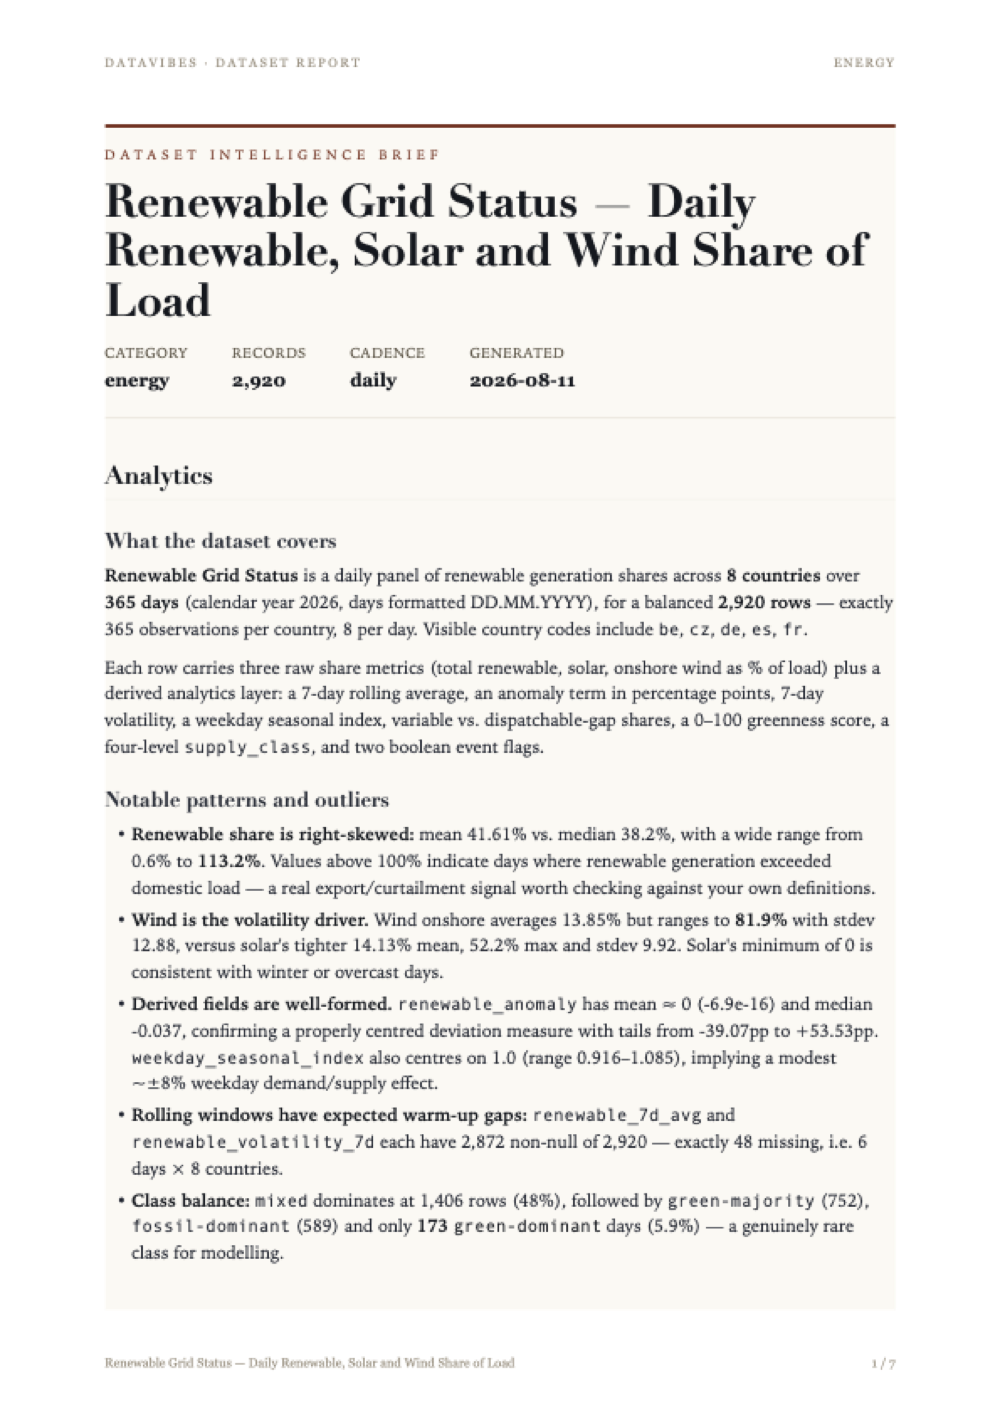
Every issue ships with a written brief: what the data covers, the patterns worth acting on, and the statistical work behind each derived column — with the limitations stated plainly rather than buried.
The page shown here is the first of the full report included in your download. Tap it to read at full size.
Method and limitations
Dataset Overview
The renewable-grid-status dataset holds 2,920 daily observations spanning 8 countries (be, cz, de, es, fr, and three others) across 365 calendar days, each country contributing exactly 365 rows — a fully balanced country × day panel with no gaps in the primary key. The measured base quantities are the daily renewable share of load (renewable_share_pct, mean 41.61%, median 38.2%, sd 19.25), the solar share (solar_share_pct, mean 14.13%), and the onshore wind share (wind_onshore_share_pct, mean 13.85%, sd 12.88).
Preparation
- Normalize — column names/values brought to a common form ahead of any joining.
- Join on
country+day— the per-country daily records were merged on the composite key, producing the one-row-per-country-per-day grain confirmed by the distinct counts (8 countries × 365 days = 2,920 rows). - Null filter — rows lacking
renewable_share_pctwere dropped, so the target variable is complete (2,920/2,920 non-null) and every downstream derivation rests on an observed value rather than an imputed one. - Sort by
country— groups the panel so that the per-country windowed statistics are computed over contiguous blocks.
Derived Measures
Additive composition (variable_share_pct)
Solar and onshore wind shares are summed to give the weather-driven, non-dispatchable share of load: mean 27.98%, median 24.9%, sd 16.07, range 0.2–86.8%. The mean is consistent with the sum of the two component means (14.13 + 13.85 = 27.98), as expected of a pure linear derivation.
Residual (dispatchable_gap_pct)
Defined as renewable_share_pct − variable_share_pct, this isolates the non-variable renewable remainder (hydro, biomass, offshore or other categories folded into the headline share). Mean 13.63 pp, median 12.6, range 0.4–52.2. All values are positive, indicating the headline renewable share always exceeds the solar-plus-onshore-wind sum in this data.
Rolling mean (renewable_7d_avg, window = 7, grouped by country)
A 7-day trailing average smooths day-to-day weather noise. It is defined for 2,872 of 2,920 rows; the 48 missing values equal 8 countries × 6 warm-up days, confirming the window is applied strictly within country and not spanning boundaries. Smoothing reduces dispersion as intended: sd falls from 19.25 (daily) to 15.97 (7-day), while the mean is essentially preserved (41.59 vs 41.61).
Anomaly (renewable_anomaly, grouped by country)
Each observation is expressed as a deviation in percentage points from its country's own reference level. The mean is numerically zero (−6.9e−16), the signature of a within-group mean-centering operation. Residual spread (sd 11.60) is markedly lower than the raw spread (19.25), implying that a substantial share of the total variance in renewable share is between-country level differences rather than within-country day-to-day movement. The range (−39.07 to +53.53 pp) shows pronounced positive tails — unusually green days deviate further upward than poor days deviate downward.
Rolling volatility (renewable_volatility_7d, window = 7, grouped by country)
A 7-day dispersion measure in percentage points, again with 2,872 non-null values and the same 48-row warm-up. Mean 10.45 pp, median 9.70 pp, range 2.15–33.12; the right skew (mean above median, max more than three times the mean) indicates episodic bursts of instability rather than uniformly noisy series.
Weekday seasonal index (weekday_seasonal_index, period = 7, grouped by country)
A multiplicative day-of-week factor normalised so the mean is exactly 1.000 (median 1.002). Its narrow range (0.9159–1.085, sd 0.0308) quantifies the weekday effect as at most roughly ±8% around each country's typical level — small relative to weather-driven variation, which is consistent with renewable share being driven by both generation and demand cycles that partially offset.
Composite Score
grid_greenness_score is a weighted, 0–100-scaled blend of renewable_share_pct (weight 0.7) and variable_share_pct (weight 0.3). The realised distribution spans the full scale (0 to 100) with mean 35.12 and median 32.34, sd 17.23. The slight right skew mirrors that of its inputs. Because the higher weight sits on total renewable share, the score is primarily a greenness measure with a secondary tilt toward grids whose greenness comes from weather-variable sources.
Classification and Flags
supply_class bins the renewable share into four ordered, mutually exclusive tiers evaluated top-down (≥75 → green-dominant; ≥50 → green-majority; ≥25 → mixed; otherwise fossil-dominant), with unknown as a default that never fires here. Resulting distribution:
| Class | Rows | Share of 2,920 |
|---|---|---|
| mixed | 1,406 | 48.2% |
| green-majority | 752 | 25.8% |
| fossil-dominant | 589 | 20.2% |
| green-dominant | 173 | 5.9% |
is_low_renewable_day flags renewable_share_pct < 25: 589 True / 2,331 False. This count is identical to the fossil-dominant bin, as the two rules share the same 25% threshold — the flag is a boolean restatement of the lowest class, not independent information.
is_variability_spike flags renewable_volatility_7d > 15 pp: 425 True (14.6%) / 2,495 False.
Validate closes the pipeline as a schema/consistency check.
Limitations
- Warm-up gaps.
renewable_7d_avgandrenewable_volatility_7dare undefined for the first 6 days of each country's series (48 rows). Any analysis conditioning on these columns silently drops those rows, andis_variability_spikeis necessarily False-by-absence there, so early-period spikes cannot be detected. - Out-of-range headline values.
renewable_share_pctreaches 113.2% andgrid_greenness_scoreis capped at exactly 100 and floored at exactly 0. Shares above 100% (plausible with net exports or load-vs-generation definitional mismatches) are not reconciled, and the score's saturation at the bounds implies clipping that compresses information at both extremes. - Redundant flag.
is_low_renewable_daycarries no information beyondsupply_class == 'fossil-dominant'; treating them as separate predictors would double-count the same threshold. - Arbitrary, unvalidated cutoffs. The 25/50/75% class boundaries, the 15 pp volatility threshold, and the 0.7/0.3 score weights are analyst-chosen. No sensitivity analysis is recorded, and shifting them would materially redistribute the class counts (nearly half of all rows sit in the single
mixedband, so the scheme has limited resolution in the middle of the distribution). - Composite-score collinearity.
variable_share_pctis a component ofrenewable_share_pct's subject matter (it is subtracted from it to formdispatchable_gap_pct), so the two scored inputs are structurally correlated. The 0.7/0.3 weighting therefore does not combine independent signals and the score's effective scale is hard to interpret. - Anomaly and seasonal baselines are opaque. The reference level used by
anomaly()and the estimation basis forseasonal_index()are not specified beyond grouping by country and period 7. Whether these use the full-sample mean (in-sample, hence not usable for out-of-sample detection) or a trailing baseline cannot be determined from the recorded steps. - Single-year, small country panel. With 365 days and 8 countries there is no multi-year history, so the weekday index cannot be separated from within-year seasonality, and no annual or trend component can be estimated. Country-level conclusions rest on one observation per day with no uncertainty measure.
- No pre-aggregation detail. Daily shares arrive already aggregated; sub-daily behaviour, curtailment, storage and interconnector flows are invisible, which limits interpretation of
dispatchable_gap_pctas a genuine dispatchable requirement. - Sort-dependent windowing. The pipeline sorts by
countryonly, not bycountryandday. Correct rolling and seasonal results depend on the input already being date-ordered within country; this assumption is not enforced by the recorded steps.
Provenance
Source: energy-charts.info API (Fraunhofer ISE)
Licence: CC-BY-4.0 (Fraunhofer ISE energy-charts; source data Bundesnetzagentur/SMARD, ENTSO-E)
Collected and derived with datavibes, a deterministic pipeline: the same config and timestamp always reproduce the same file.