- Records
- 12,896
- Columns
- 19
- Data through
- 2024
- Source updates
- annual
- Issue collected
- 2026-08-11
- Licence
- CC-BY-4.0
What you get
- 12,896-row CSV19 typed columns, ready for pandas, Excel or SQL
- PDF intelligence briefthe analytics read and methodology, written against this issue
- 4 chartspublication-ready PNGs of the headline relationships
- analytics.md + statistics.mdthe same findings as text, for quoting and reuse
- Versioned archiveevery past issue stays downloadable, so you can build a time series
- API accesspull the data with a scoped key instead of clicking download
What the current issue shows
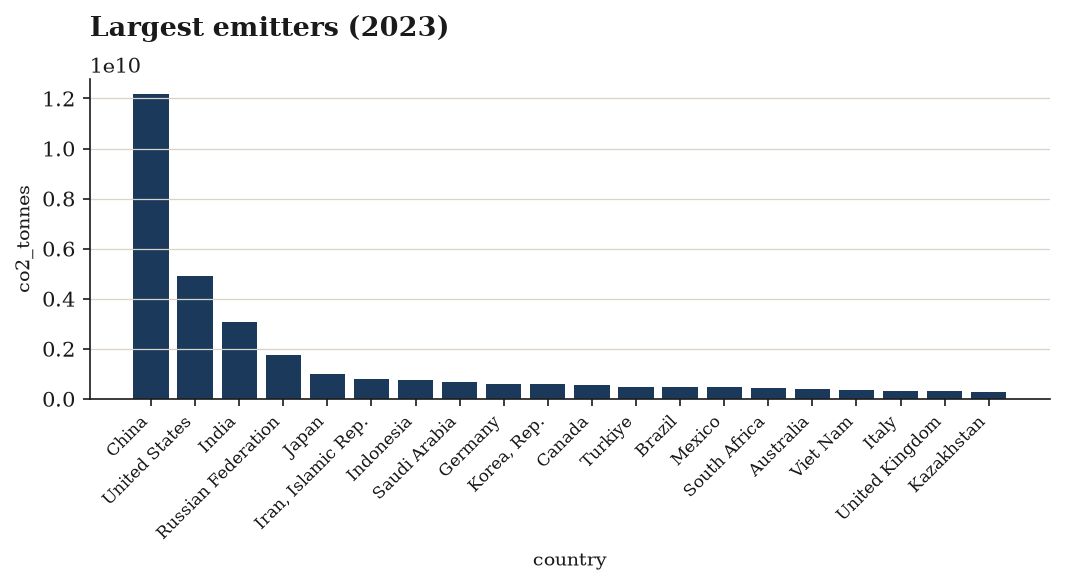
Extreme right-skew across all size measures. Emissions run from 0 to 1.229e+10 tonnes, with a mean of 1.16e+08 against a median of just 6.31e+06 — the mean is ~18× the median, and the standard deviation (5.70e+08) is roughly 5× the mean. The same shape holds for population (mean 2.76e+07 vs. median 5.10e+06) and GDP (mean 2.02e+11 vs. median 8.77e+09). Any modelling should assume log transforms.
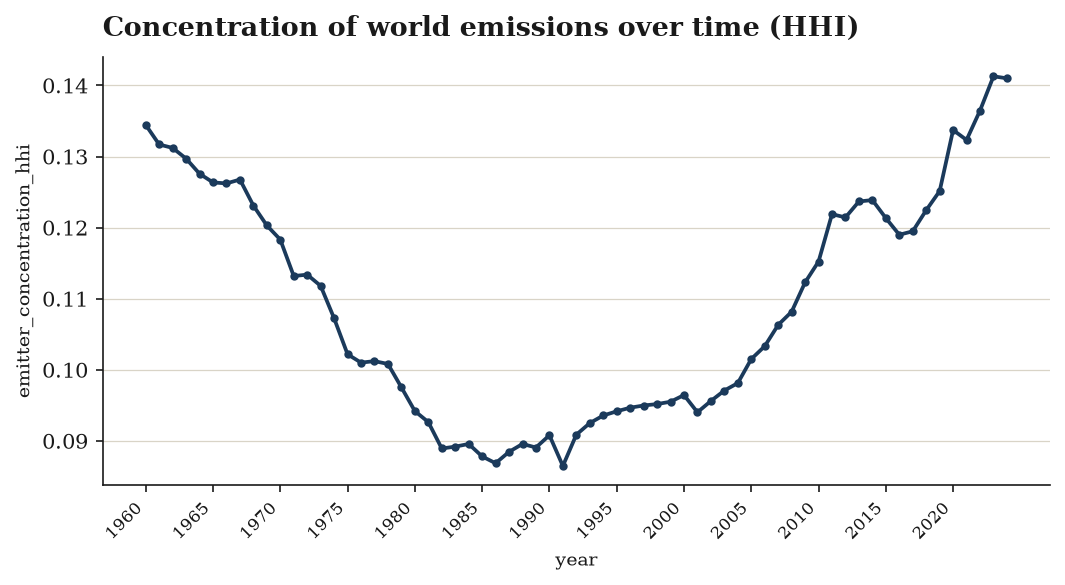
Concentration is real and quantified.global_share_pct reaches 33.13% for a single country-year while the median country-year is only 0.027%. The HHI ranges narrowly from 0.0865 to 0.1413 (mean 0.1089), giving a clean time series of how concentrated global emissions have been.
Trajectories skew heavily upward.steep-rise (5,468) plus rising (2,563) account for over 62% of rows, versus 1,107 steep-decline and 1,097 declining. Consistently, only 2,359 rows (18.3%) are flagged is_on_reduction_path, and mean projected_change_pct is +109.5% (median +112.9%).
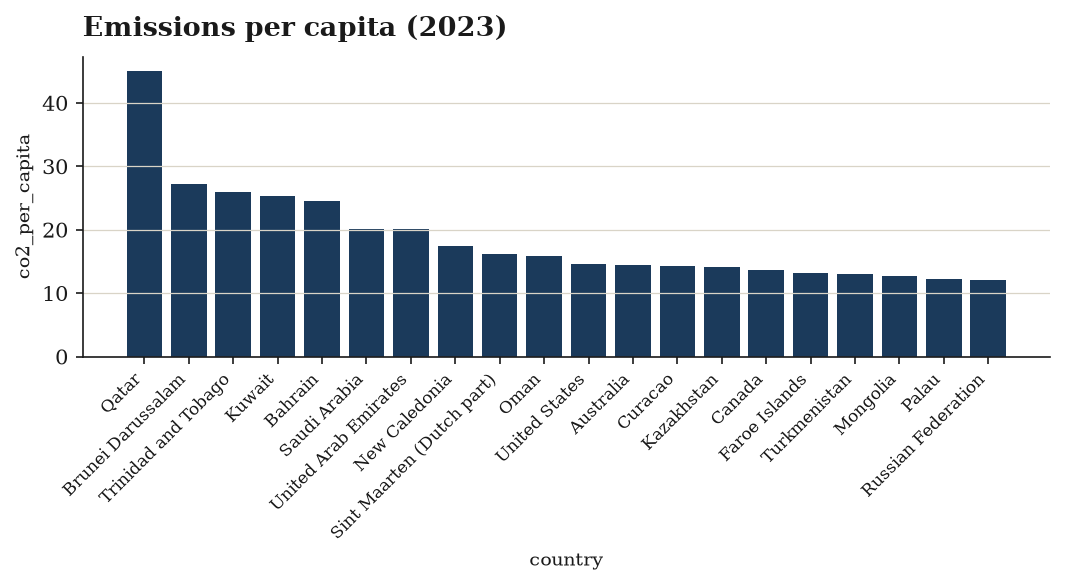
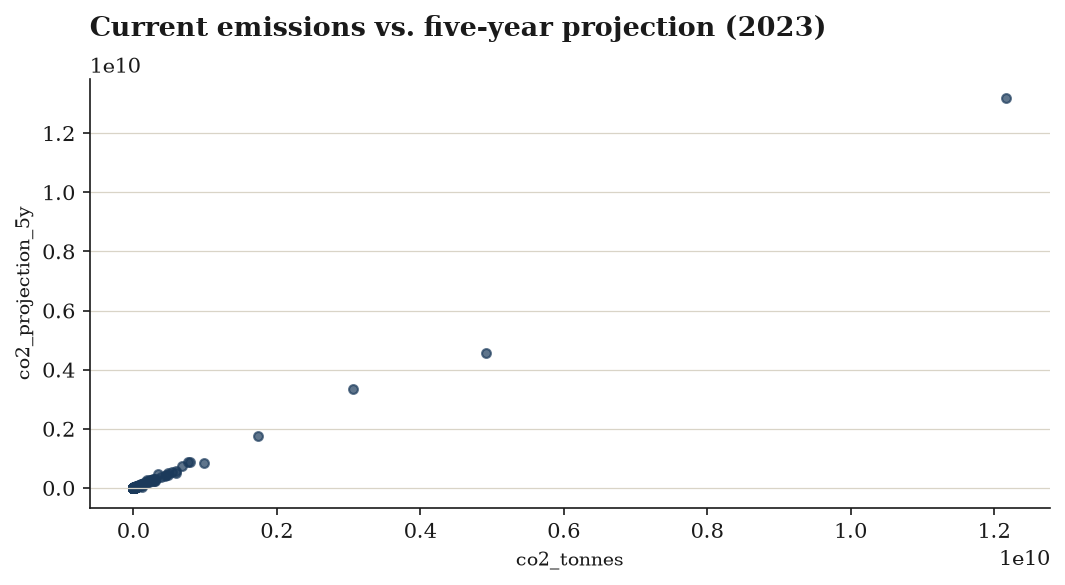
Outliers worth screening.co2_yoy_pct spans −94.48% to +3,471% with a standard deviation of 55.5 — small-base countries dominate the tails. co2_per_capita peaks at 379.7 t/person against a 2.163 median. Critically, co2_projection_5y goes negative (min −1.20e+08) and projected_change_pct reaches −1,788%, indicating the projection is an unbounded linear extrapolation, not a floored forecast. Filter these before publishing.
Completeness caveats. GDP and co2_per_usd_gdp are missing 1,807 rows (14%); co2_cagr_10y missing 2,044 (matching exactly the 2,044 unknown trajectory rows — early years lacking history); projections missing 1,836.
Charts included
Data preview
| country | iso3 | year | co2_tonnes | population | gdp_usd | co2_per_capita |
|---|---|---|---|---|---|---|
| Aruba | ABW | 1960 | 618561.0 | 54922.0 | 11.262535960088853 | |
| Aruba | ABW | 1961 | 645553.0 | 55578.0 | 11.61526143438051 | |
| Aruba | ABW | 1962 | 708942.0 | 56320.0 | 12.587748579545455 | |
| Aruba | ABW | 1963 | 679088.0 | 57002.0 | 11.913406547138697 | |
| Aruba | ABW | 1964 | 660275.0 | 57619.0 | 11.459327652336903 | |
| Aruba | ABW | 1965 | 592387.0 | 58190.0 | 10.18021996906685 | |
| Aruba | ABW | 1966 | 553944.0 | 58694.0 | 9.43783010188435 | |
| Aruba | ABW | 1967 | 682359.0 | 58990.0 | 11.567367350398372 |
First 8 of 12,896 rows and 12 further columns. The download carries every row and column.
Every column, defined
countryiso3yearco2_tonnes(tonnes CO₂) — annual territorial CO₂ emissionspopulation(persons)gdp_usd(current USD)co2_per_capita(tonnes/person)co2_per_usd_gdp(kg CO₂/USD) — carbon intensity of outputco2_yoy_pct(%) — year-over-year change in emissionsco2_cagr_10y(%) — 10-year compound growth of emissionsco2_5y_avg(tonnes CO₂) — trailing 5-year meanco2_projection_5y(tonnes CO₂) — linear trend over the last 10 years, projected 5 years aheadprojected_change_pct(%) — projected 5-year change against the current levelglobal_share_pct(%) — country share of that year's cohort emissionsemitter_concentration_hhi— HHI of world emissions that year — how concentrated the emitter base istrajectory_class— steep-decline | declining | plateau | rising | steep-riseemitter_tier— mega | major | mid | minor emitteris_on_reduction_path— 10-year compound emissions growth below zerois_top_emitter— holds more than 1% of world emissions that year
Inside the PDF brief
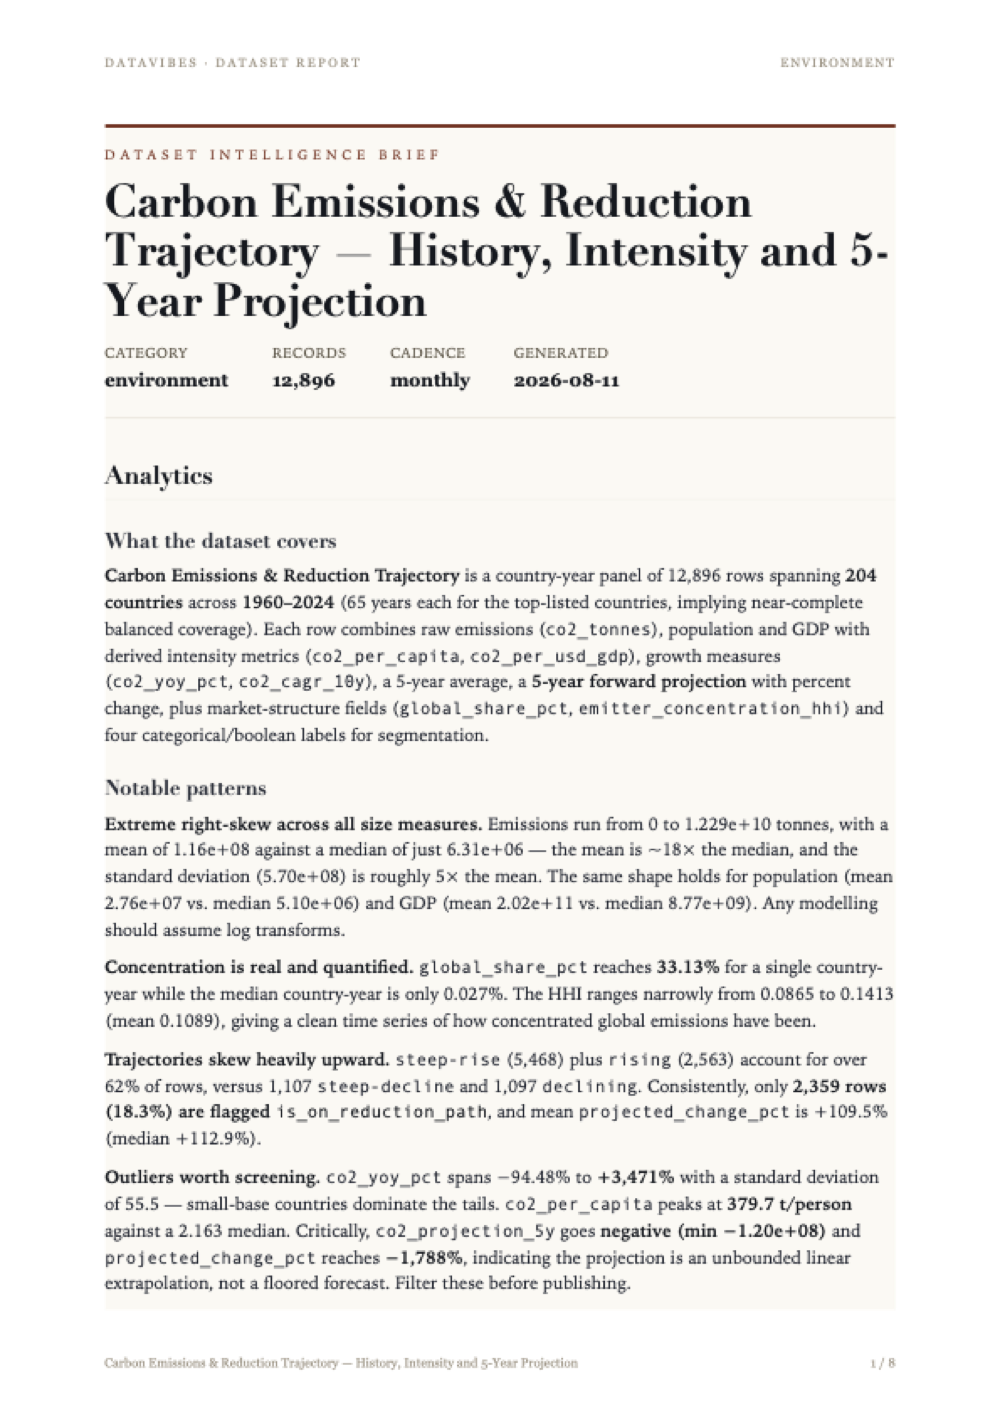
Every issue ships with a written brief: what the data covers, the patterns worth acting on, and the statistical work behind each derived column — with the limitations stated plainly rather than buried.
The page shown here is the first of the full report included in your download. Tap it to read at full size.
Method and limitations
1. Scope and Unit of Analysis
The dataset carbon-emissions-trajectory (category: environment) is a country-year panel: 12,896 rows, 204 distinct countries (identified by iso3), spanning 1960–2024. The year distribution is symmetric (mean 1993, median 1993, stdev 18.7), and the top country counts are uniform at 65 rows each (65 = 1960..2024 inclusive), indicating a balanced or near-balanced panel for the leading entities.
The analytical unit is therefore (country, year), and every derived statistic below is computed either within a country's time series (by: iso3) or across countries within a year (by: year).
2. Preparation Before Any Statistics
The statistical layer rests on a sequence of shaping operations that determine what is measurable:
- Rename — source fields
Entity,Code,Year,Annual CO₂ emissionswere mapped tocountry,iso3,year,co2_tonnes. - Entity filter — rows with null or empty
iso3were dropped. This is a substantive statistical decision: it removes aggregate pseudo-entities (regions, income groups, "World") that lack an ISO3 code, so that later cross-sectional shares and concentration measures are computed over countries only and do not double-count. - Normalize, then join on the composite key
['iso3', 'year']— this attachespopulationandgdp_usdto the emissions series. - Completeness filters — rows lacking
co2_tonnesorpopulationwere removed. Notably,gdp_usdwas not filtered on, which is why it remains the only sparse input column (11,089 / 12,896 non-null, ≈14.0% missing). - Sort by
['iso3', 'year']— a prerequisite for all lag-, window- and sequence-dependent derivations that follow.
3. Derived Measures
3.1 Intensity ratios (row-wise)
| Metric | Definition | Coverage | Observed range |
|---|---|---|---|
co2_per_capita | ratio(co2_tonnes, population) | 12,896 (100%) | 0 – 379.7 t/person |
co2_per_usd_gdp | ratio(co2_tonnes, gdp_usd) | 11,089 (86.0%) | 0 – 0.1263 kg CO₂/USD |
Both are simple normalisations rather than models. co2_per_capita has mean 5.293 against median 2.163 — a strongly right-skewed distribution (stdev 12.46), meaning the arithmetic mean is pulled well above the typical country-year by a small number of extreme per-capita emitters. co2_per_usd_gdp shows the same pattern (mean 0.001292 vs median 0.0006114). The carbon-intensity metric inherits the missingness of gdp_usd exactly: 11,089 non-null in both.
3.2 Growth statistics (within-country, time-ordered)
co2_yoy_pct—yoy(co2_tonnes)partitionedby iso3. 12,688 non-null; the 208 nulls correspond to each country's first observed year, which has no predecessor. Range −94.48% to +3,471% with stdev 55.5 — a single-period percentage change is extremely volatile when the base value is small.co2_cagr_10y—cagr(co2_tonnes, years=10)partitionedby iso3. 10,852 non-null; the 2,044 nulls are the burn-in period (roughly the first decade of each country's series). Mean 3.634%, median 3.048%, range −31.64% to +113%. The CAGR is a two-point endpoint statistic over a 10-year span and is materially smoother than YoY (stdev 6.511 vs 55.5).co2_5y_avg—rolling_avg(co2_tonnes, window=5)partitionedby iso3. 12,080 non-null (816 nulls from window burn-in). This smoothed series tracks the raw series closely (mean 1.162e+08 vs 1.16e+08 forco2_tonnes), confirming the rolling mean is centred on the same level and mainly suppresses short-run noise.
3.3 Cross-sectional aggregations (within-year)
global_share_pct—share_of_total(co2_tonnes)partitionedby year. Each country-year's emissions expressed as a percentage of that year's total across all retained countries. Range 0 – 33.13%, mean 0.504%, median 0.02723%. With 204 countries, an equal split would be ≈0.49% — the mean sits at essentially that value (as it must, arithmetically), while the median is ~18× lower, quantifying the severity of the concentration.emitter_concentration_hhi—hhi(co2_tonnes)partitionedby year. A Herfindahl–Hirschman Index of emitter concentration, constant within each year and therefore repeated across that year's rows. It ranges 0.08648 – 0.1413 (mean 0.1089, median 0.1063), so global emissions concentration has moved within a fairly narrow band across the covered period. Because the value is duplicated across all countries in a year, the reported mean/stdev are row-weighted, not year-weighted, and should not be read as the average annual HHI unless the panel is balanced.
3.4 Forecast and projected change
co2_projection_5y—forecastonco2_tonnes, partitionedby iso3, horizon = 5, window = 10. Each country's projection is extrapolated from its trailing 10-year window. 11,060 non-null (1,836 nulls where the 10-year fitting window is unavailable). The critical diagnostic: the minimum is −1.203e+08 tonnes, a physically impossible negative emissions value. This confirms the forecast is an unconstrained linear-style extrapolation with no non-negativity floor.projected_change_pct—share(co2_projection_5y, co2_tonnes), i.e. the projection expressed relative to the current-year value. Mean 109.5, median 112.9, range −1,788 to +915.2. The central tendency near 110 indicates the typical country-year projects to roughly 110% of its current emissions over the 5-year horizon; the extreme tails are driven by small denominators and by the negative projections noted above.
4. Classification and Flagging
trajectory_class — a 5-bin cut on co2_cagr_10y with an unknown default:
| Label | Rule (on 10y CAGR) | Rows |
|---|---|---|
| steep-decline | ≤ −2.0% | 1,107 |
| declining | ≤ −0.2% | 1,097 |
| plateau | ≤ 0.5% | (residual) |
| rising | ≤ 3.0% | 2,563 |
| steep-rise | > 3.0% | 5,468 |
| unknown | CAGR null | 2,044 |
The unknown count (2,044) matches the co2_cagr_10y null count exactly, confirming the default captures only burn-in rows. steep-rise is the modal class at 42.4% of rows, consistent with the median CAGR of 3.048% sitting right at the upper bin boundary — meaning the class assignment is highly sensitive to that 3.0% cut point.
emitter_tier — a 4-bin cut on global_share_pct: mega (≥5%, 250 rows), major (≥1%, 931), mid (≥0.1%, 3,348), minor (<0.1%, 8,367). No unknown occurs because global_share_pct is fully populated. 64.9% of country-years fall in the minor tier.
Boolean flags (both derived from already-computed columns, so they add no new information beyond a threshold):
- is_on_reduction_path = co2_cagr_10y < 0 → 2,359 True (18.3%). Note this is less than the 2,204 steep-decline + declining rows plus any plateau rows below zero; the flag treats nulls as False, so the 2,044 unknown rows are silently classed as not-on-path.
- is_top_emitter = global_share_pct > 1.0 → 1,181 True, which equals the mega (250) + major (931) tiers exactly — an internal consistency check that passes.
A final validate step closes the pipeline.
5. Limitations
Missing-data asymmetry.gdp_usd is 14.0% missing and was deliberately not filtered out. Consequently co2_per_usd_gdp is undefined for 1,807 country-years, and any analysis comparing carbon intensity across countries is conditioned on GDP availability — which is not missing at random (it disproportionately affects smaller and earlier observations). Per-capita and per-GDP metrics therefore rest on different samples and are not directly comparable.
Structurally missing derived values. Nulls in co2_yoy_pct (208), co2_5y_avg (816), co2_cagr_10y (2,044) and co2_projection_5y (1,836) are all burn-in artefacts of within-country windowing, not data quality problems. They are nonetheless systematically concentrated in the earliest years of each country's series, so any pooled statistic over these columns is implicitly biased toward later periods.
Forecast is unconstrained and mechanical. The 5-year projection is a per-country extrapolation from a 10-year trailing window with no floor at zero — evidenced by a minimum of −1.203e+08 tonnes. It embeds no policy, technology, structural-break or saturation assumptions, and treats each country in isolation with no cross-country pooling or shared trend. Projections for countries with volatile or short recent histories should be treated as unreliable. Likewise, projected_change_pct spans −1,788% to +915%, tails that are arithmetic artefacts rather than credible scenarios.
Ratio instability at small denominators.co2_yoy_pct reaches +3,471% and co2_per_capita reaches 379.7 t/person. Both are consequences of very small bases (co2_tonnes min = 0; population min = 2,715 persons). Zero values in co2_tonnes also mean CAGR and YoY are undefined or degenerate for some segments. Means on all skewed columns are not representative — medians should be preferred throughout.
Threshold sensitivity in classification. Bin edges for trajectory_class and emitter_tier are fixed and unexplained. The median 10-year CAGR (3.048%) sits essentially on the rising/steep-rise boundary of 3.0%, so roughly half the panel is separated by a hair's-breadth; small changes to the cut would reshuffle thousands of rows. The classes are descriptive labels, not statistically validated regimes.
Flags conflate "no" with "unknown".is_on_reduction_path is False for 10,537 rows, but 2,044 of those have a null CAGR and are simply unmeasurable. Reading the False count as "countries not reducing" overstates the case by roughly a fifth.
Repeated year-level values.emitter_concentration_hhi is a per-year scalar broadcast to every row in that year. Any row-level mean, stdev or correlation involving it is weighted by the number of countries present in each year rather than by year, and will mislead if country coverage varies over time.
Composition dependence of shares.global_share_pct and the HHI are computed over the retained ISO3 countries only. Dropping non-ISO3 aggregates was correct for avoiding double-counting, but it also means "global" here is the sum of coverable countries in that year. If country coverage expands over 1960–2024, shares and concentration are not strictly comparable across the full time span.
No uncertainty quantification. No confidence intervals, standard errors, backtest accuracy or residual diagnostics are reported for the forecast, and no significance testing accompanies the growth statistics. All figures are point estimates.
Descriptive, not causal. Every metric here is an accounting identity, a growth rate, a share or an extrapolation. Nothing in the pipeline supports causal claims about why emissions rise or fall, and intensity ratios in particular (emissions per capita, per USD) are correlational normalisations, not attributions.
Provenance
Source: Our World in Data — Global Carbon Budget (annual CO₂ emissions); World Bank (population, GDP)
Licence: CC-BY-4.0 (Our World in Data / Global Carbon Budget); World Bank Open Data CC-BY-4.0
Collected and derived with datavibes, a deterministic pipeline: the same config and timestamp always reproduce the same file.