- Records
- 5,760
- Columns
- 23
- Data through
- 2026-08-11
- Source updates
- hourly
- Issue collected
- 2026-08-11
- Licence
- CC-BY-4.0
What you get
- 5,760-row CSV23 typed columns, ready for pandas, Excel or SQL
- PDF intelligence briefthe analytics read and methodology, written against this issue
- 4 chartspublication-ready PNGs of the headline relationships
- analytics.md + statistics.mdthe same findings as text, for quoting and reuse
- Versioned archiveevery past issue stays downloadable, so you can build a time series
- API accesspull the data with a scoped key instead of clicking download
What the current issue shows
- Ozone dominates the pollutant mix. Mean O₃ is 75.2 µg/m³ (max 164) versus 13.7 for PM10 and 8.6 for PM2.5 — consistent with a summer sampling window where photochemical ozone, not particulates, is the binding constraint.
- Air quality is mostly benign. European AQI averages 31.85 (median 29, max 66), and
aqi_bandis concentrated in fair (3,782 rows, 66%) with only 177 poor rows and zero worse categories. - Exceedances are rare and asymmetric. WHO PM2.5 daily limits are breached in 228 rows (4.0%), but PM10 in only 5 rows — a 46:1 imbalance that makes the PM10 flag near-unusable as a training target.
- Right-skewed tails. PM2.5 z-scores reach +5.25 against a floor of -2.65, and the anomaly max (36.05) is ~5× the minimum magnitude (-7.65). Health risk score shows the same shape: median 17.65 but max 73.24. NO₂ (mean 10.54, median 7.9, max 68.3) and SO₂ (mean 1.86, median 1.2, max 42.2) are similarly heavy-tailed — a handful of hours drive most of the risk.
- Clean derived features. PM2.5 anomaly and z-score are correctly centred (mean ≈ 0, stdev ≈ 1.0), and
diurnal_indexaverages exactly 1.0 — indicators of properly normalised feature engineering. - Only missingness: the two 24-hour rolling averages have 5,070/5,760 non-null (690 nulls = 23 cities × 30 hours' worth of warm-up, the expected rolling-window burn-in).
Charts included
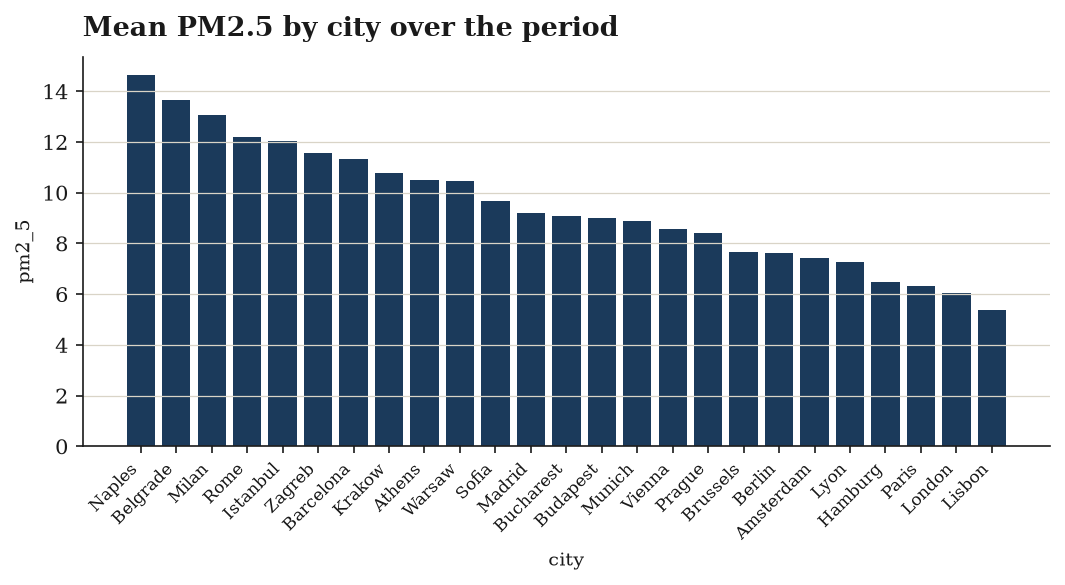
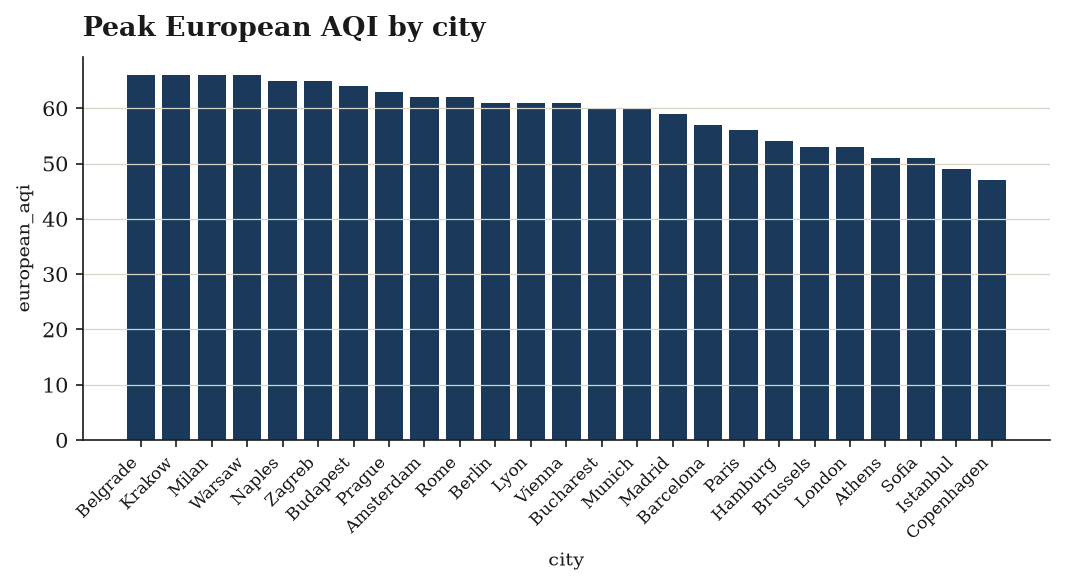
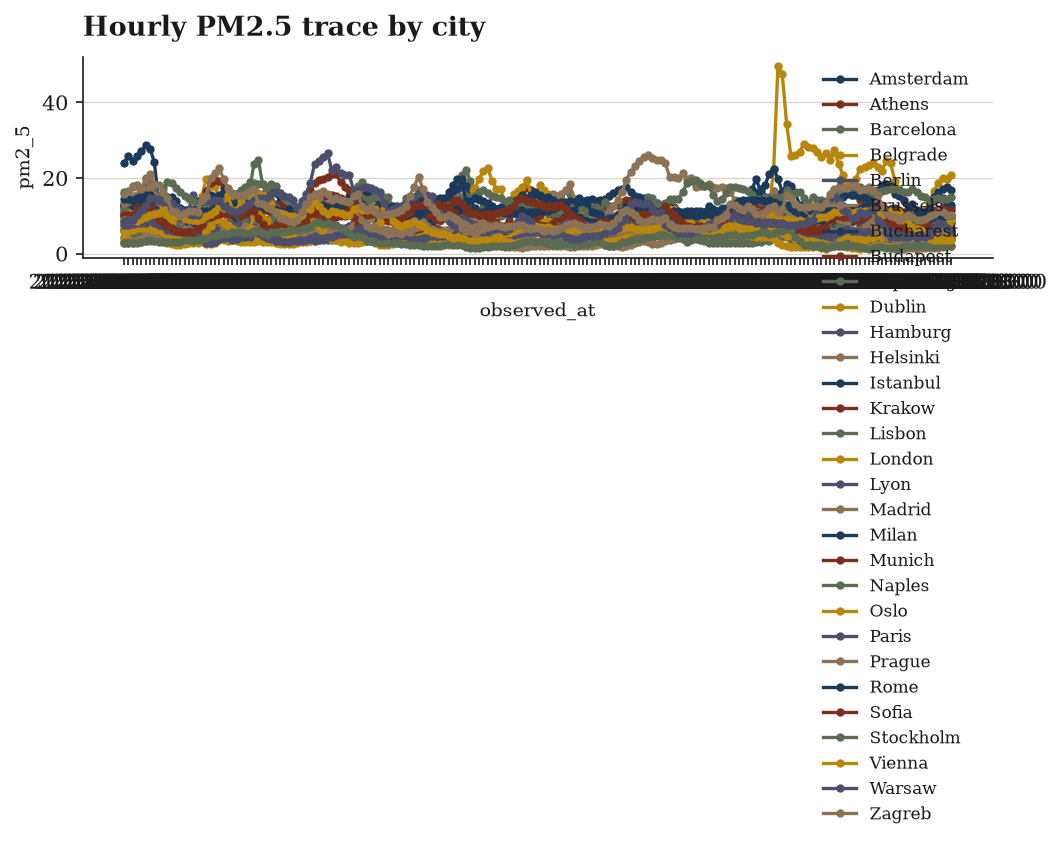
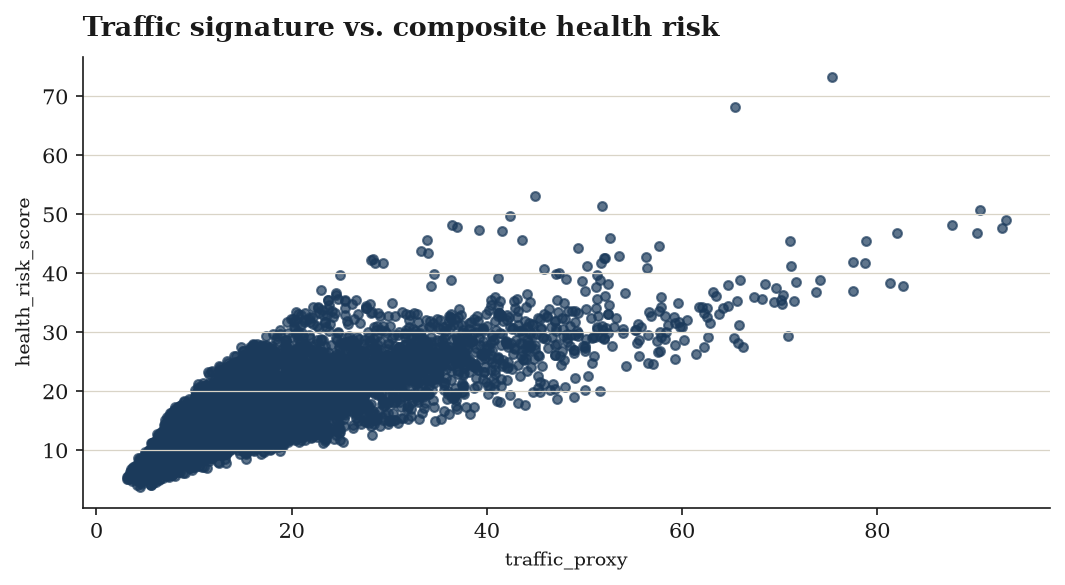
Data preview
| city | country | latitude | longitude | observed_at | pm10 | pm2_5 |
|---|---|---|---|---|---|---|
| Amsterdam | NL | 52.37 | 4.9 | 2026-08-04T00:00 | 32.7 | 23.9 |
| Amsterdam | NL | 52.37 | 4.9 | 2026-08-04T01:00 | 31.2 | 25.9 |
| Amsterdam | NL | 52.37 | 4.9 | 2026-08-04T02:00 | 27.4 | 24.6 |
| Amsterdam | NL | 52.37 | 4.9 | 2026-08-04T03:00 | 27.7 | 25.8 |
| Amsterdam | NL | 52.37 | 4.9 | 2026-08-04T04:00 | 29.3 | 27.2 |
| Amsterdam | NL | 52.37 | 4.9 | 2026-08-04T05:00 | 34.5 | 28.6 |
| Amsterdam | NL | 52.37 | 4.9 | 2026-08-04T06:00 | 34.9 | 27.8 |
| Amsterdam | NL | 52.37 | 4.9 | 2026-08-04T07:00 | 25.3 | 24.2 |
First 8 of 5,760 rows and 16 further columns. The download carries every row and column.
Every column, defined
citycountrylatitudelongitudeobserved_at— local hour, ISO-8601pm10(µg/m³)pm2_5(µg/m³)nitrogen_dioxide(µg/m³)ozone(µg/m³)sulphur_dioxide(µg/m³)carbon_monoxide(µg/m³)european_aqi(EAQI) — European Air Quality Indexpm2_5_24h_avg(µg/m³) — trailing 24-hour mean — the basis of the WHO daily guidelinepm10_24h_avg(µg/m³)pm2_5_anomaly(µg/m³) — deviation from the city's period meanpm2_5_zscore— standardised within the city's own seriesdiurnal_index— hour-of-day seasonal index — 1.20 means that hour runs 20% above the city averagepm_ratio— PM2.5 ÷ PM10 — high = combustion-dominated, low = dust/road-weartraffic_proxy— NO₂ + PM2.5, the road-traffic signaturehealth_risk_score— 0-100 composite of the WHO-weighted pollutant loadaqi_band— good | fair | moderate | poor | very-poorexceeds_who_pm25_daily— 24-hour PM2.5 mean above the 15 µg/m³ WHO 2021 guidelineexceeds_who_pm10_daily— 24-hour PM10 mean above the 45 µg/m³ WHO 2021 guideline
Inside the PDF brief
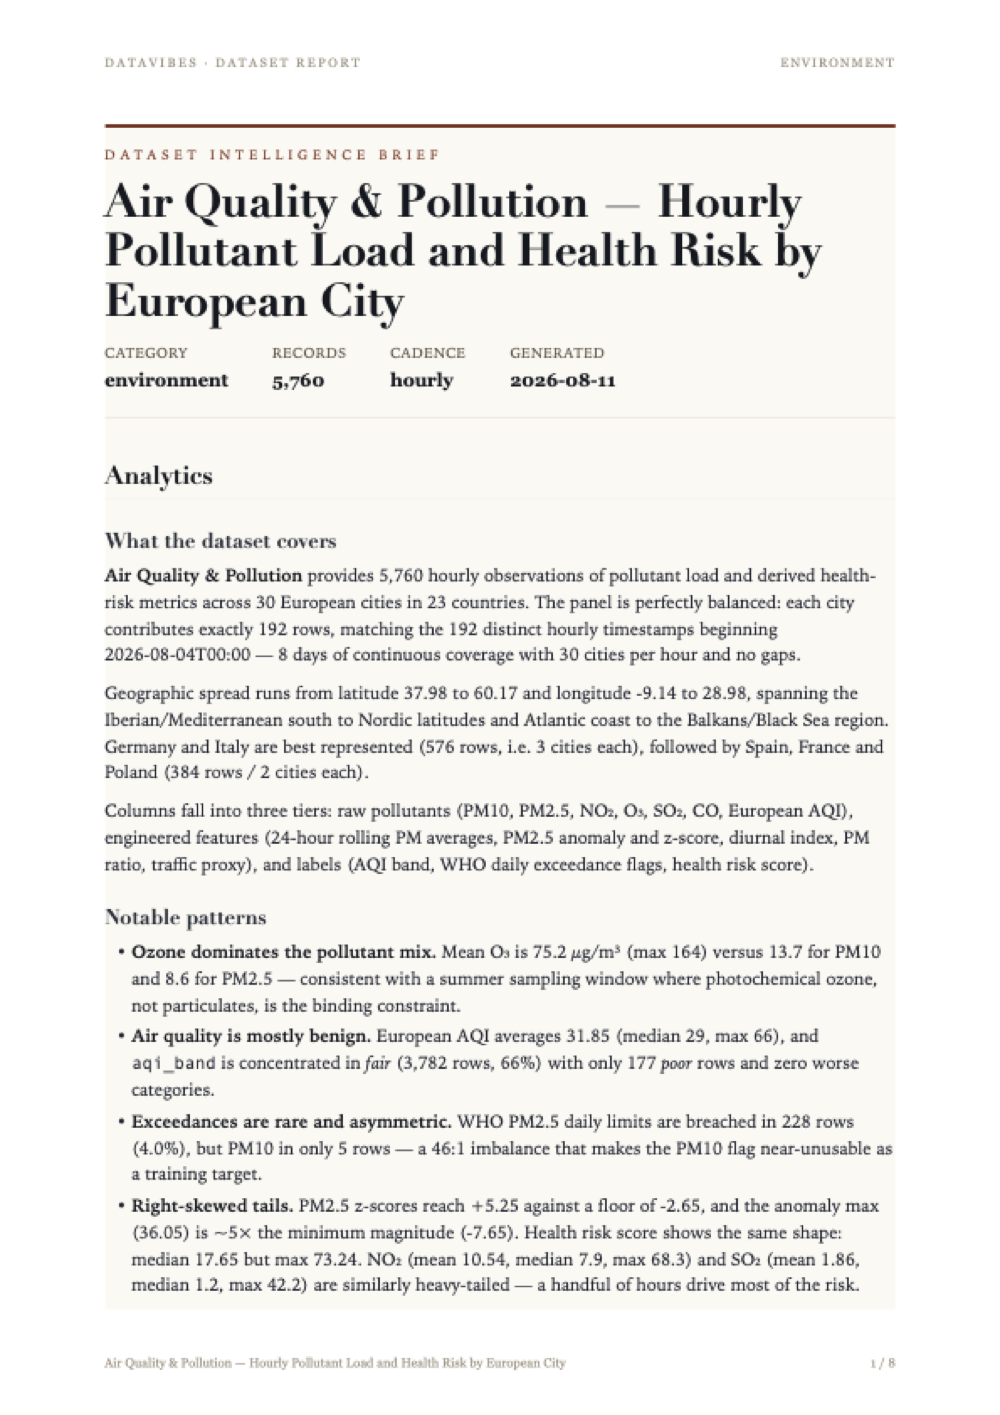
Every issue ships with a written brief: what the data covers, the patterns worth acting on, and the statistical work behind each derived column — with the limitations stated plainly rather than buried.
The page shown here is the first of the full report included in your download. Tap it to read at full size.
Method and limitations
Dataset Overview
The dataset covers 5,760 hourly observations of air quality across 30 European cities in 23 countries, spanning 192 distinct timestamps (starting 2026-08-04T00:00). Each city contributes exactly 192 rows, indicating a balanced panel of 8 days × 24 hours per city. Geographic coordinates span latitude 37.98–60.17 and longitude −9.14–28.98, consistent with a pan-European footprint.
Six primary pollutant measurements are present (PM10, PM2.5, NO₂, O₃, SO₂, CO, all in µg/m³) alongside a reported european_aqi index (10–66 EAQI, mean 31.85).
Preparation Steps
- Normalize — schema/value normalization applied prior to any statistical derivation.
- Deduplicate on the composite key
(city, observed_at), enforcing one record per city-hour. This makes the city-hour the atomic unit of analysis and prevents double-counting in downstream aggregates. - Filter to rows where
pm2_5is non-null. PM2.5 is the anchor variable for most derived metrics, so completeness here is a precondition (all 5,760 surviving rows are non-null on every pollutant column). - Sort by
(city, observed_at)— a required ordering step, since the rolling and seasonal derivations that follow are order-dependent within each city.
Derived Statistics
Rolling aggregations (windowed means)
pm2_5_24h_avg=rolling_avg(pm2_5, window=24), partitioned by citypm10_24h_avg=rolling_avg(pm10, window=24), partitioned by city
These are trailing 24-hour arithmetic means, computed independently per city so that no city's window borrows values from another. Both columns have 5,070 of 5,760 non-null values — a deficit of 690 = 30 cities × 23 hours, exactly the warm-up period where fewer than 24 prior observations exist. The smoothing effect is visible in the reduced dispersion: PM2.5 stdev falls from 4.302 (hourly) to 3.745 (24h mean), and the maximum collapses from 49.7 to 26.75, since short-lived spikes are averaged away. Central tendency is essentially preserved (mean 8.631 → 8.607).
Within-city standardization
pm2_5_anomaly=anomaly(pm2_5), by city — the deviation of each observation from its own city's mean PM2.5, expressed in µg/m³. The grand mean is ≈ 0 (−4.4e−17, floating-point zero), which is the expected algebraic consequence of mean-centering within balanced groups. The median of −0.474 indicates a right-skewed residual distribution: most hours sit slightly below their city mean, with a thinner tail of high-pollution hours reaching +36.05 µg/m³.pm2_5_zscore=zscore(pm2_5), by city — the same centering divided by each city's own standard deviation, yielding a unitless comparable scale. Grand mean ≈ 0 and stdev 0.9975 (≈1) confirm correct per-group standardization. The range is asymmetric (−2.645 to +5.254), reinforcing the skew: no city dips more than ~2.6 SD below its own norm, but at least one hour exceeds +5 SD — an extreme local pollution event.
Seasonal (diurnal) decomposition
diurnal_index=seasonal_index(pm2_5, period=24), by city — a multiplicative hour-of-day index with period 24, computed per city. It is normalized around 1.0 (mean exactly 1.000), so a value of 1.2 denotes an hour typically 20% above that city's daily average PM2.5. The observed range 0.718 to 1.519 quantifies the diurnal amplitude: the quietest hours run ~28% below the daily norm and the peak hours ~52% above. The median (0.9873) sitting just below 1 again reflects the skew — more hours are modestly below average than above.
Ratios and composite proxies
pm_ratio=ratio(pm2_5, pm10)— the fine-to-coarse particulate fraction. Mean and median are both ≈ 0.625, a strikingly symmetric distribution (stdev 0.110) ranging 0.288–0.957. Higher values suggest combustion-dominated fine particulate; lower values imply a larger coarse (dust/mechanical) component.traffic_proxy=add(nitrogen_dioxide, pm2_5)— an unweighted sum of the two pollutants most associated with vehicular emissions (mean 19.17, median 16.3, max 93.2). Its right skew (mean > median) is inherited from NO₂, itself the most skewed primary pollutant (mean 10.54 vs median 7.9).
Weighted composite score
health_risk_score is a linear weighted sum of five pollutants scaled to 100:
| Pollutant | Weight |
|---|---|
| pm2_5 | 0.35 |
| pm10 | 0.20 |
| nitrogen_dioxide | 0.20 |
| ozone | 0.15 |
| sulphur_dioxide | 0.10 |
Weights sum to 1.00, with PM2.5 carrying the largest single influence (35%) and particulates jointly 55%. The resulting distribution has mean 18.36 and median 17.65 on a 0–100 scale, range 3.77–73.24, stdev 6.966 — right-skewed, so a small number of city-hours carry disproportionately high composite risk. Note that carbon monoxide is excluded from the score despite being present in the data.
Classification and threshold flags
aqi_band bins european_aqi into ordered categories with a right-open upper bin and an unknown default:
| Band | EAQI range | Count | Share |
|---|---|---|---|
| good | ≤ 20 | 821 | 14.3% |
| fair | 20–40 | 3,782 | 65.7% |
| moderate | 40–60 | 980 | 17.0% |
| poor | 60–80 | 177 | 3.1% |
| very-poor | > 80 | 0 | 0% |
The very-poor band and the unknown default are both unpopulated (only 4 distinct labels observed), consistent with the observed EAQI maximum of 66. The distribution is concentrated in "fair," with roughly 80% of hours at "fair" or better.
Two boolean exceedance flags encode WHO daily guideline breaches, applied to the rolling 24-hour means rather than raw hourly values — the methodologically appropriate comparator for daily guidelines:
exceeds_who_pm25_daily=pm2_5_24h_avg > 15→ 228 True (3.96%)exceeds_who_pm10_daily=pm10_24h_avg > 45→ 5 True (0.087%)
The near-100× disparity in flag rates reflects that the PM2.5 threshold (15) is far more binding relative to the observed distribution (median 8.275) than the PM10 threshold (45) is relative to its own (median 12.69). The PM10 maximum of 46.05 barely clears 45, explaining the tiny count.
A final validate step closes the pipeline.
Limitations
Coverage and window warm-up. The two rolling means are null for 690 rows (11.98%) — the first 23 hours of each city's series. Consequently both WHO exceedance flags are evaluated on incomplete input: a False in those 690 rows cannot be distinguished from "not assessable." Any exceedance rate computed over all 5,760 rows understates the true rate relative to a denominator of 5,070 assessable rows (3.96% → 4.50% for PM2.5).
Short series and unstable per-city statistics. With only 192 hours (8 days) per city, the per-city mean, standard deviation, and 24-period seasonal index rest on thin samples. The diurnal index in particular is estimated from roughly 8 observations per hour-of-day slot, so it conflates genuine daily cycles with day-to-day weather variation and cannot separate weekday from weekend behaviour.
Standardization masks absolute levels.pm2_5_anomaly and pm2_5_zscore are city-relative by construction. A z-score of 0 means "typical for this city," not "clean" — a chronically polluted city and a clean one both center at zero. These columns support within-city event detection but must not be used for cross-city ranking of pollution burden.
Outliers are retained, not treated. The +5.25 z-score and the +36.05 µg/m³ anomaly (over 11× the anomaly stdev) indicate extreme values that were neither winsorized nor excluded. Because they enter the same city's mean and standard deviation, such points inflate the denominator of their own z-score and depress the apparent extremity of neighbouring hours. The same values propagate into pm2_5_24h_avg and thus into the WHO flags.
Composite score is an unvalidated construct. The health_risk_score weights are analyst-specified, not empirically fitted to health outcomes, and the linear additive form assumes pollutants contribute independently with no interaction or threshold effects. Because the inputs are summed in their native µg/m³ units before scaling, pollutants with larger numeric ranges exert influence beyond their nominal weight — ozone (mean 75.2) enters at a scale roughly nine times PM2.5 (mean 8.63) despite carrying less than half the weight. Carbon monoxide is omitted entirely. The score's absolute magnitude is therefore not interpretable; only relative comparisons within this dataset are meaningful.
Binning discards information and edge cases are ambiguous. The aqi_band classification collapses a continuous 10–66 index into four realized categories, and bin boundaries are specified only by max, leaving the treatment of exact boundary values (EAQI = 20, 40, 60) unstated in the provided steps. Two bins (very-poor, unknown) are empty, so the scheme has more resolution than the data exercises.
Threshold sensitivity. With PM10's 24-hour maximum at 46.05 against a threshold of 45, the exceeds_who_pm10_daily flag has only 5 positives and is highly sensitive to small measurement or rounding differences. Any statistic derived from it will be unstable.
Structural and provenance gaps. Country representation is unbalanced (DE and IT contribute 576 rows each, i.e. 3 cities apiece, while others contribute 192), so country-level aggregates are weighted by city count and are not population- or area-representative. Timestamps are stored as strings without timezone information, so a nominal hour is not necessarily the same solar or local hour across a longitude span of 38 degrees — a material concern for the diurnal index. Deduplication on (city, observed_at) silently resolves conflicts; the retention rule and the number of duplicates removed are not recorded. Finally, the observed_at values are dated 2026, indicating forecast or synthetic rather than historical measurements, and no measurement uncertainty, station metadata, or instrument provenance is available to support inference beyond this dataset.
Provenance
Source: Open-Meteo Air Quality API (air-quality-api.open-meteo.com), based on CAMS
Licence: CC-BY-4.0 (Open-Meteo Air Quality API; CAMS European air quality reanalysis)
Collected and derived with datavibes, a deterministic pipeline: the same config and timestamp always reproduce the same file.