- Records
- 6,317
- Columns
- 19
- Data through
- 2024
- Source updates
- annual
- Issue collected
- 2026-08-11
- Licence
- CC-BY-4.0
What you get
- 6,317-row CSV19 typed columns, ready for pandas, Excel or SQL
- PDF intelligence briefthe analytics read and methodology, written against this issue
- 4 chartspublication-ready PNGs of the headline relationships
- analytics.md + statistics.mdthe same findings as text, for quoting and reuse
- Versioned archiveevery past issue stays downloadable, so you can build a time series
- API accesspull the data with a scoped key instead of clicking download
What the current issue shows
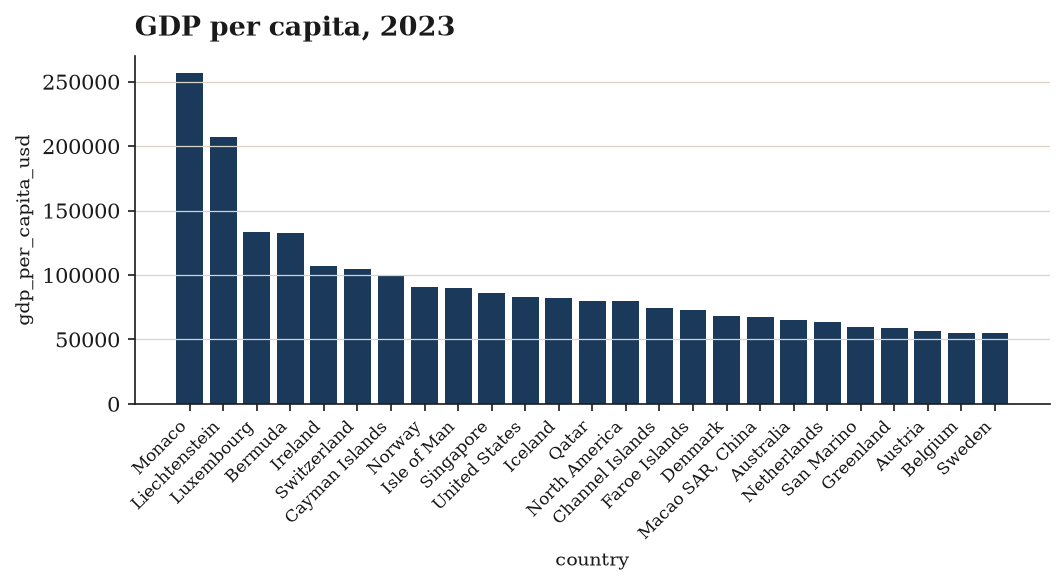
Extreme income dispersion. GDP per capita ranges from $109.6 to $287,600, with a mean of $15,090 against a median of $5,190 — a mean roughly 2.9× the median, indicating heavy right skew. The income z-score confirms this: minimum −0.68 but maximum +8.09, meaning the richest observations sit eight standard deviations above the mean while the poorest cluster within one below.
Population aggregates inflate the tails. Population spans 9,544 to 8.14 billion with a mean of 273 million against a median of 9.6 million — the upper values clearly reflect World Bank aggregate rows, not sovereign states. The same applies to population_share_pct (median 0.014%, max 10.56%). Users should filter aggregates before cross-country modelling.
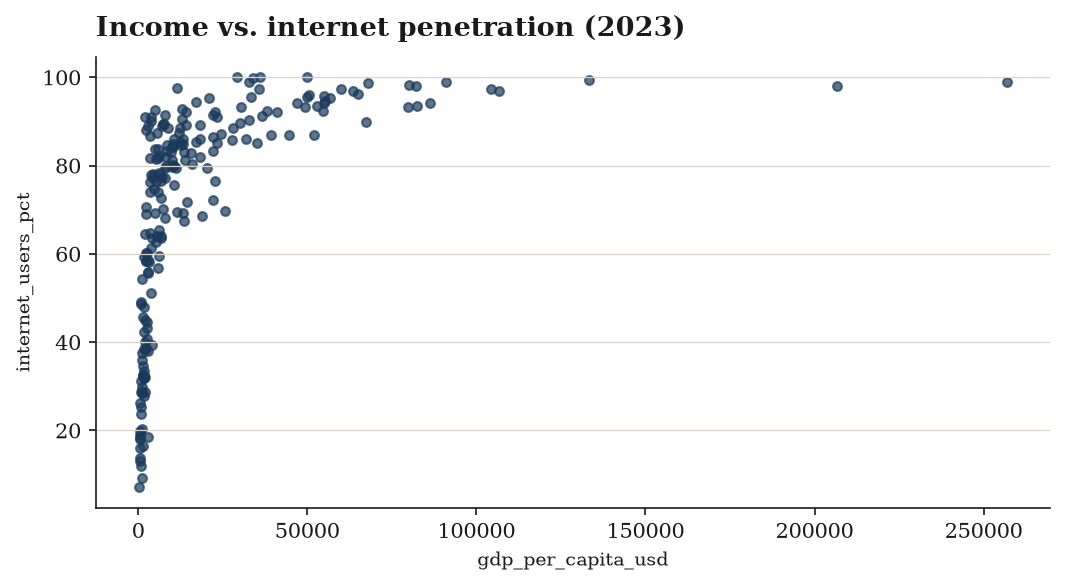
Development gradients. Life expectancy averages 70.6 years (median 72) but bottoms out at 14.66 — a catastrophic-event outlier worth inspecting. Electricity access is strongly left-skewed toward saturation (median 98%, mean 81.3%, min 1.3%), whereas internet users average only 39.6% (median 33.8%) with a full 0–100 spread — the connectivity frontier is far less converged than the electrification frontier. Consistently, only 1,040 of 6,317 rows are flagged digitally connected versus 2,909 electrified.
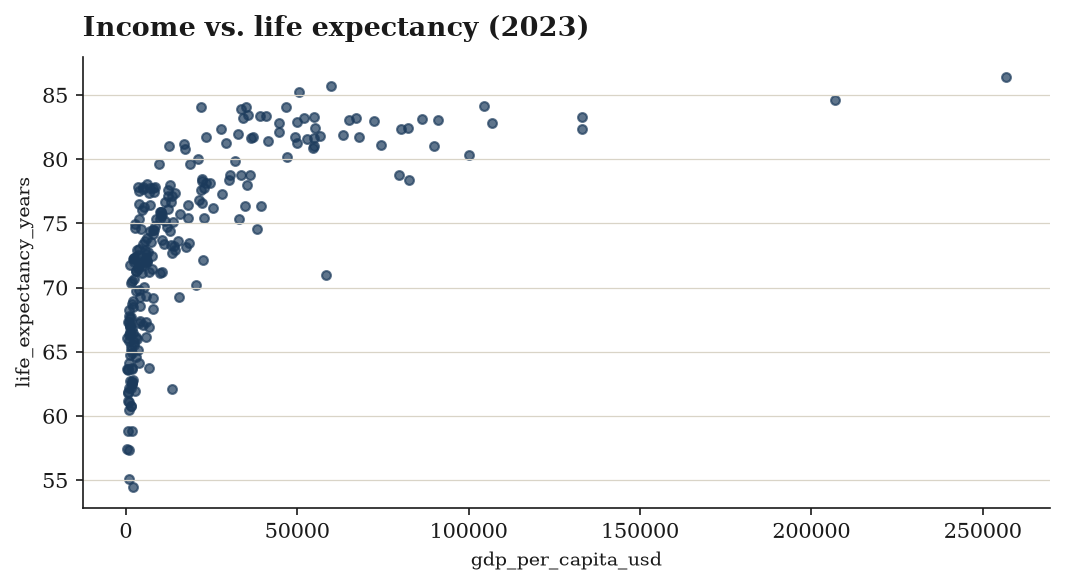
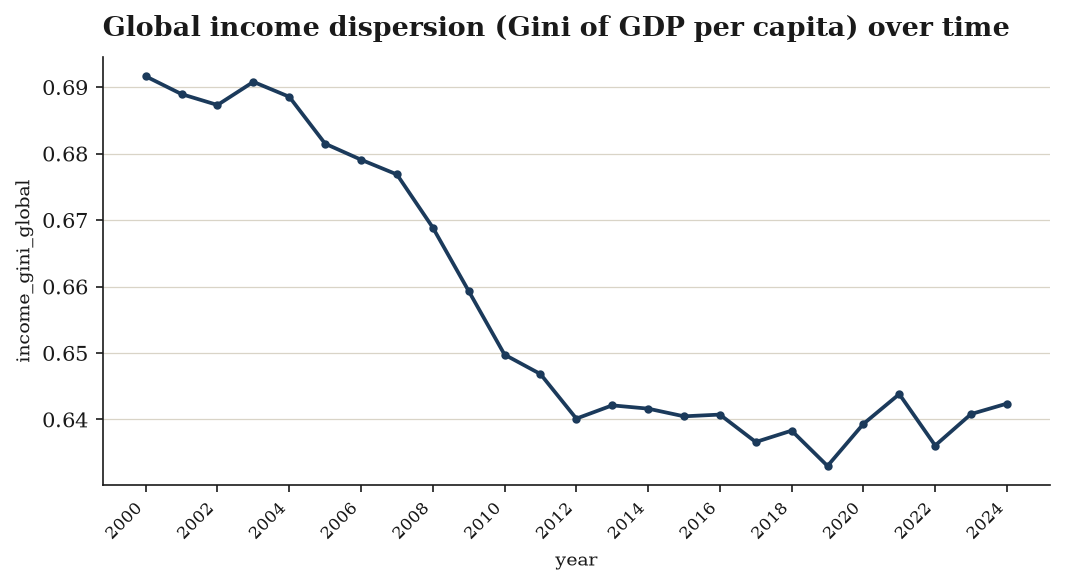
Structural relationships. The income–longevity correlation averages 0.77 (median 0.85) but dips to −0.49, flagging contexts where the growth–health link breaks down. Global income Gini is tightly bounded (0.633–0.692), suggesting limited movement in global inequality over the period.
Coverage caveats. Education spending is the sparsest field (4,229/6,317, 67%), followed by GDP CAGR (3,755, 59%) and internet CAGR (4,206). Internet users are 85% complete; core income, population, longevity and derived scores are 100% complete.
Charts included
Data preview
| country | iso3 | year | gdp_per_capita_usd | population | life_expectancy_years | internet_users_pct |
|---|---|---|---|---|---|---|
| Aruba | ABW | 2000 | 20681.0230269625 | 90588.0 | 72.939 | 15.4428229480349 |
| Aruba | ABW | 2001 | 20740.1325828172 | 91439.0 | 73.044 | 17.1 |
| Aruba | ABW | 2002 | 21307.2482505267 | 92074.0 | 73.135 | 18.8 |
| Aruba | ABW | 2003 | 21949.4859960868 | 93128.0 | 73.236 | 20.8 |
| Aruba | ABW | 2004 | 23700.6319899197 | 95138.0 | 73.223 | 23.0 |
| Aruba | ABW | 2005 | 24171.8371325422 | 97635.0 | 73.415 | 25.4 |
| Aruba | ABW | 2006 | 24845.65848362 | 99405.0 | 73.498 | 28.0 |
| Aruba | ABW | 2007 | 26736.3089444046 | 100150.0 | 73.642 | 30.9 |
First 8 of 6,317 rows and 12 further columns. The download carries every row and column.
Every column, defined
countryiso3yeargdp_per_capita_usd(current USD)population(persons)life_expectancy_years(years)internet_users_pct(% of population)electricity_access_pct(% of population)education_spend_pct_gdp(% of GDP)gdp_per_capita_cagr_10y(%) — 10-year compound growth of income per headinternet_cagr_5y(%) — 5-year compound growth of internet penetrationpopulation_share_pct(%) — country share of the cohort population that yearincome_gini_global— Gini of GDP-per-capita across all countries in that year — global income dispersionincome_zscore— standardised income per head within the yearincome_longevity_corr— within-country correlation of income and life expectancy over the perioddevelopment_score— 0-100 composite of income, longevity, connectivity and electrificationdevelopment_tier— advanced | upper-middle | lower-middle | low-incomeis_digitally_connected— more than 75% of the population onlineis_electrified— universal or near-universal electricity access (≥99%)
Inside the PDF brief
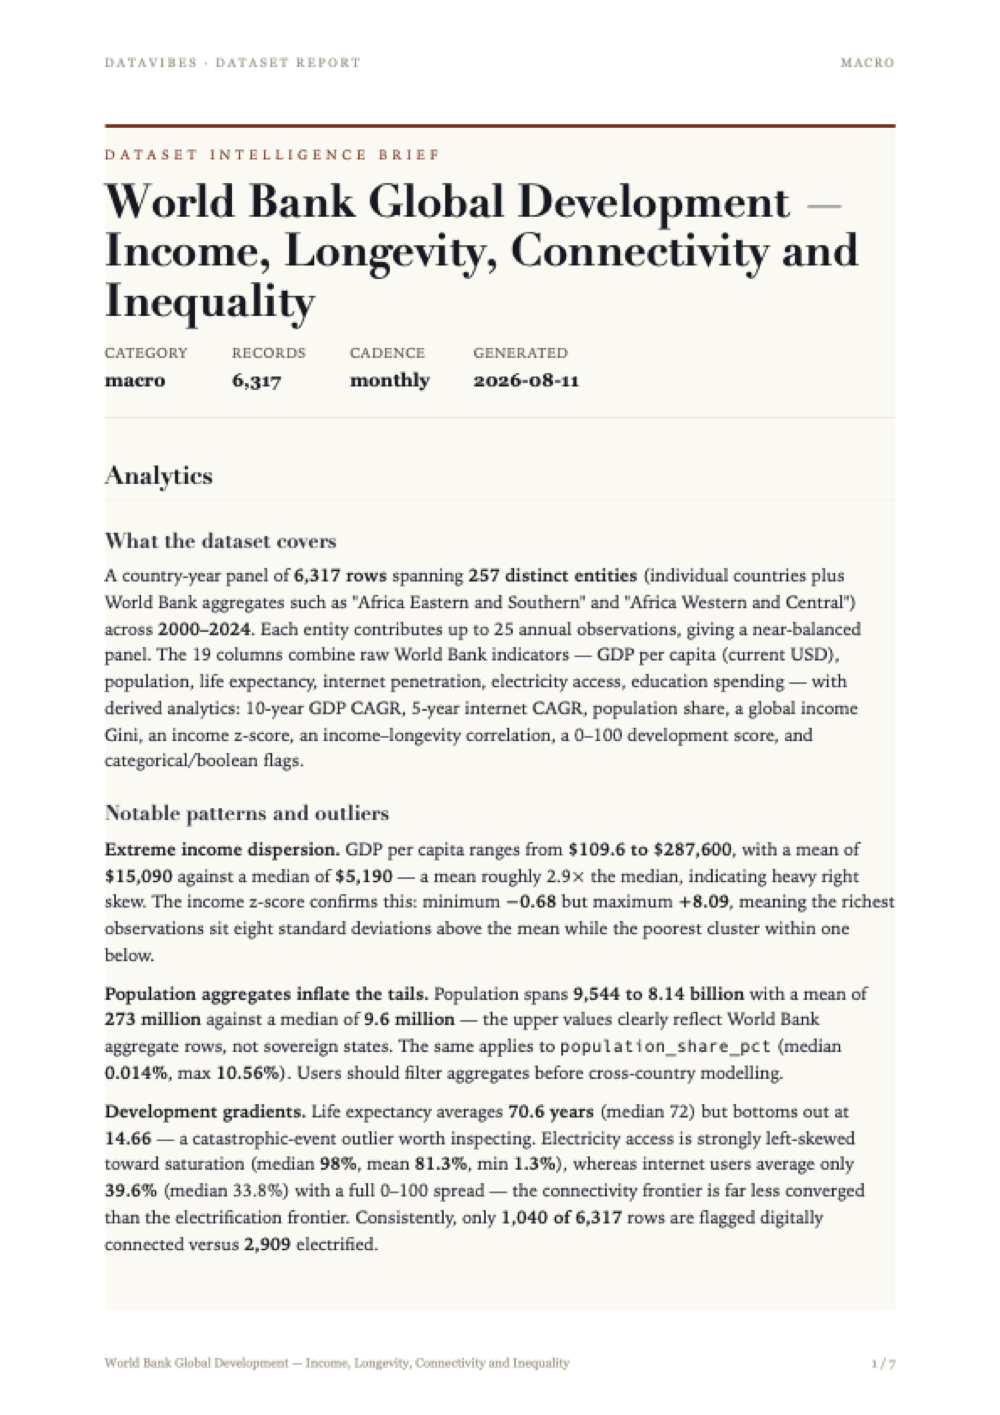
Every issue ships with a written brief: what the data covers, the patterns worth acting on, and the statistical work behind each derived column — with the limitations stated plainly rather than buried.
The page shown here is the first of the full report included in your download. Tap it to read at full size.
Method and limitations
Dataset Overview
The world-bank-global-development dataset is a country-year panel covering 6,317 observations across 257 reporting entities (country / iso3) and 25 annual periods (2000–2024, mean and median year 2012, stdev 7.17). Each row combines four raw World Bank indicators — GDP per capita (current USD), population, life expectancy, and two infrastructure/access measures (internet penetration, electricity access) — plus education spending as a share of GDP. The remaining columns are all products of the processing pipeline described below.
Panel balance is effectively complete for the identifier and core income/population/longevity fields (6,317/6,317 non-null), while access and spending indicators are partially observed: internet_users_pct 5,400 (85.5%), electricity_access_pct 6,270 (99.3%), education_spend_pct_gdp 4,229 (66.9%).
Preparation Steps
- Normalize — column/label harmonisation prior to any numeric work.
- Join on the composite key
['iso3', 'year'], which is the natural grain of the panel and the basis for aligning the separate indicator series. - Filter to rows where
gdp_per_capita_usdis non-null. This makes GDP per capita the anchor variable: every surviving row has an income observation, which is why that column shows 100% completeness while others do not. - Sort by
['iso3', 'year'], establishing the ordered within-country time series required for the lag-based growth derivations that follow.
Derived Statistical Measures
Within-country growth rates (by: iso3)
gdp_per_capita_cagr_10y— compound annual growth rate of GDP per capita over a 10-year window, computed per country. Coverage 3,755/6,317 (59.4%), consistent with the loss of the first years of each country's series to the 10-year lookback. Distribution: min −19.78%, max 26.16%, mean 4.74%, median 3.83%, stdev 5.09. The mean exceeding the median indicates a right-skewed growth distribution.internet_cagr_5y— 5-year CAGR of internet penetration, per country. Coverage 4,206 (66.6%). Range −5.70% to 262.9%, mean 16.26%, median 11.09%, stdev 18.06. The extreme upper tail is a structural artefact of computing growth rates from near-zero early-period bases.
Within-country association
income_longevity_corr— the correlation betweengdp_per_capita_usdandlife_expectancy_yearscomputed within each country across its available years, then broadcast back to every row of that country. Values run from −0.4867 to 0.9892 with mean 0.7697 and median 0.8488, indicating that for most countries income and longevity moved together over the period. Because the statistic is constant per country, its 6,317 non-null values represent at most 257 distinct underlying estimates.
Cross-sectional (within-year) distributional statistics (by: year)
population_share_pct— each entity's population as a share of the year total. Range 1.2e-05% to 10.56%, mean 0.396%, median 0.0139%. The mean-to-median gap of roughly 28× reflects extreme concentration; note also that shares sum to well above 100% per year because the entity list mixes countries with aggregates (e.g. "Africa Eastern and Southern", "Africa Western and Central") — evidenced bypopulationreaching 8.141e9, a world-level figure.income_gini_global— a Gini coefficient of GDP per capita computed over the cross-section of entities in each year. Values span 0.633–0.6916 (mean 0.6569, median 0.6438, stdev 0.0210), i.e. only 25 distinct annual values repeated across rows. The narrow band indicates near-stable between-entity income dispersion over the 25 years.income_zscore— GDP per capita standardised within year (mean ≈ 0 by construction, stdev 0.998). The distribution is strongly right-skewed: median −0.4298 against a maximum of 8.092, so the median entity sits below its year's mean income and a small number of entities sit many standard deviations above it.
Composite score
development_score— a weighted composite scaled to 0–100 using weightsgdp_per_capita_usd0.35,life_expectancy_years0.25,internet_users_pct0.25,electricity_access_pct0.15 (summing to 1.00). Observed range 1.723–99.76, mean 43.51, median 44.18, stdev 15.01. The near-coincidence of mean and median suggests the scaling step compressed the heavy income skew visible inincome_zscore.
Classification and Flags
development_tier— ordered binning on raw GDP per capita: ≥25,000 →advanced; ≥8,000 →upper-middle; ≥2,000 →lower-middle; otherwiselow-income(defaultunknown). Resulting counts: lower-middle 1,915; low-income 1,874; advanced 1,268; upper-middle 1,260. Nounknownrows appear among the four distinct values, consistent with the earlier non-null filter on the binning variable.is_digitally_connected— boolean flag forinternet_users_pct > 75. True in 1,040 rows (16.5%), False in 5,277.is_electrified— boolean flag forelectricity_access_pct >= 99. True in 2,909 rows (46.0%), False in 3,408. The medianelectricity_access_pctof 98 sits just below this threshold, so the flag is highly sensitive to the exact cut-point.
A final validate step closes the pipeline.
Limitations
- Mixed entity granularity. The 257
iso3values include regional and income-group aggregates alongside sovereign countries. Any statistic computedby: yearacross all rows —income_gini_global,income_zscore,population_share_pct— therefore pools countries with sums of countries, double-counting populations and incomes.population_share_pctin particular does not sum to 100%. - Selection via the income filter. Retaining only rows with non-null
gdp_per_capita_usdconditions the entire panel on income reporting. Entity-years lacking GDP data are absent, so completeness figures for other columns are conditional, not absolute. - Growth-rate coverage and instability.
gdp_per_capita_cagr_10y(59.4% coverage) andinternet_cagr_5y(66.6%) are undefined for the opening years of each country series, biasing growth analyses toward later periods and toward entities with long uninterrupted histories. Theinternet_cagr_5ymaximum of 262.9% demonstrates the small-denominator problem inherent to percentage-based CAGR. - Broadcast correlations.
income_longevity_corris a country-level constant replicated across rows; treating its 6,317 values as independent observations would overstate sample size roughly 25-fold. Its reliability also varies with each country's series length, which is not recorded. The correlation is descriptive only and carries no causal content. - Nominal, unadjusted income. GDP per capita is in current USD, so all income-based derivations (growth, Gini, z-scores, tiering, score) blend real growth with inflation and exchange-rate movements. The fixed tier thresholds (25,000 / 8,000 / 2,000) are not deflated, so entities can drift upward across tiers over 2000–2024 through price effects alone.
- Composite score construction. The 0.35/0.25/0.25/0.15 weights are analyst-imposed and unvalidated; no sensitivity analysis is recorded. The score also mixes a component with 14.5% missingness (
internet_users_pct) with fully observed components, and the handling of those gaps is not specified — yetdevelopment_scoreis non-null for all 6,317 rows, implying some implicit imputation or renormalisation. - Unused column.
education_spend_pct_gdp(66.9% coverage; minimum 4.01e-06, an implausibly small value suggesting data-quality issues) enters no derivation, classification, or score. - Threshold brittleness and floor/ceiling effects. Both boolean flags rest on single hard cut-points, with
is_electrifiedespecially sensitive given the median of 98 versus a 99 threshold. Several inputs are bounded percentages saturating at 0 and 100 (internet_users_pct,electricity_access_pct), which truncates variance at the top of the distribution. - Extreme values retained.
life_expectancy_yearsreaches a minimum of 14.66, far outside normal national ranges and likely reflecting a crisis year or a data error; no outlier treatment appears in the pipeline, so such values propagate intoincome_longevity_corranddevelopment_score. - Validation opaque. The terminal
validatestep is recorded without criteria or outcomes, so it cannot be confirmed what was checked or whether any rows failed.
Provenance
Source: World Bank Open Data — Indicators API (NY.GDP.PCAP.CD, SP.POP.TOTL, SP.DYN.LE00.IN, IT.NET.USER.ZS, EG.ELC.ACCS.ZS, SE.XPD.TOTL.GD.ZS)
Licence: World Bank Open Data CC-BY-4.0
Collected and derived with datavibes, a deterministic pipeline: the same config and timestamp always reproduce the same file.