- Records
- 24
- Columns
- 16
- Data through
- 2026-08-11
- Source updates
- weekly
- Issue collected
- 2026-08-11
- Licence
- CC-BY-SA-4.0
What you get
- 24-row CSV16 typed columns, ready for pandas, Excel or SQL
- PDF intelligence briefthe analytics read and methodology, written against this issue
- 4 chartspublication-ready PNGs of the headline relationships
- analytics.md + statistics.mdthe same findings as text, for quoting and reuse
- Versioned archiveevery past issue stays downloadable, so you can build a time series
- API accesspull the data with a scoped key instead of clicking download
What the current issue shows
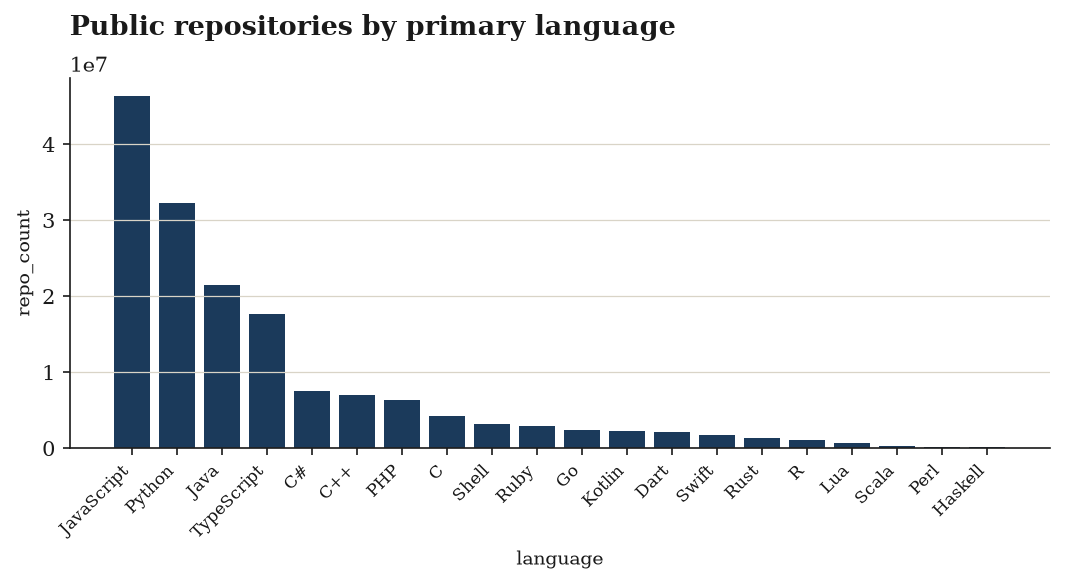
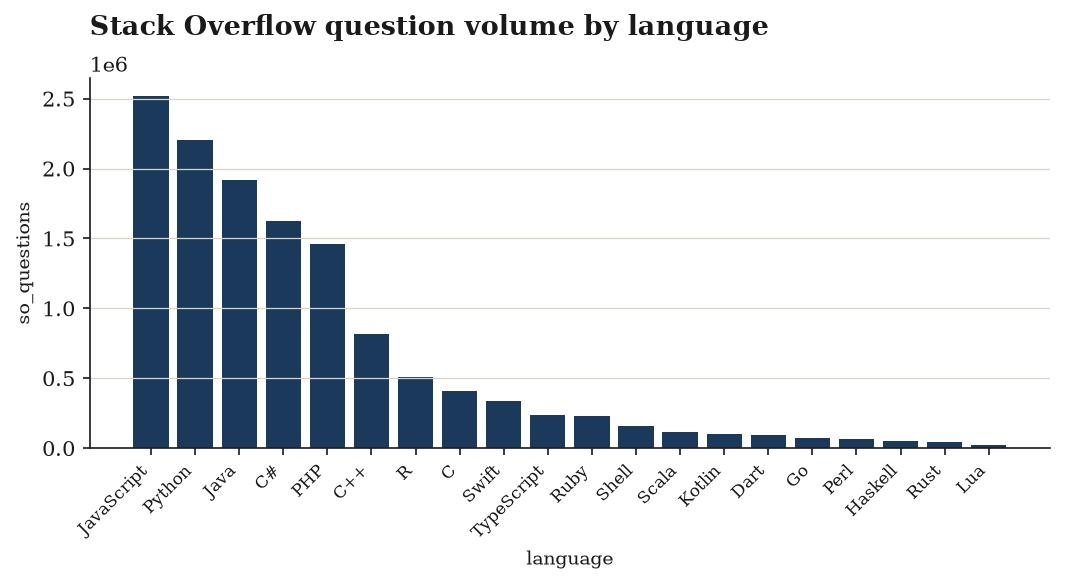
Extreme concentration. Repository counts span three orders of magnitude — from 36,490 to 46.38M — with a mean (6.73M) more than triple the median (2.16M) and a standard deviation (11.57M) larger than the mean. Stack Overflow questions show the same shape: 458 to 2.52M, mean 542,500 vs. median 134,700. Both distributions are severely right-skewed.
Two dataset-level constants confirm this: Gini = 0.7139 and HHI = 0.1597 across all rows. The single largest language holds 28.71% of repositories and 19.37% of questions, while the smallest holds 0.023% and 0.0035% respectively.
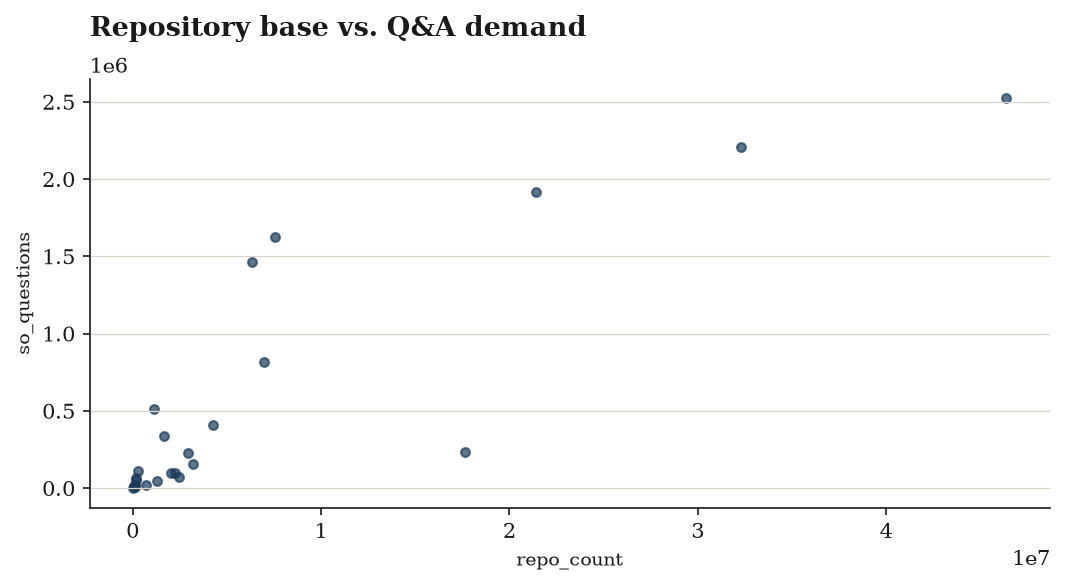
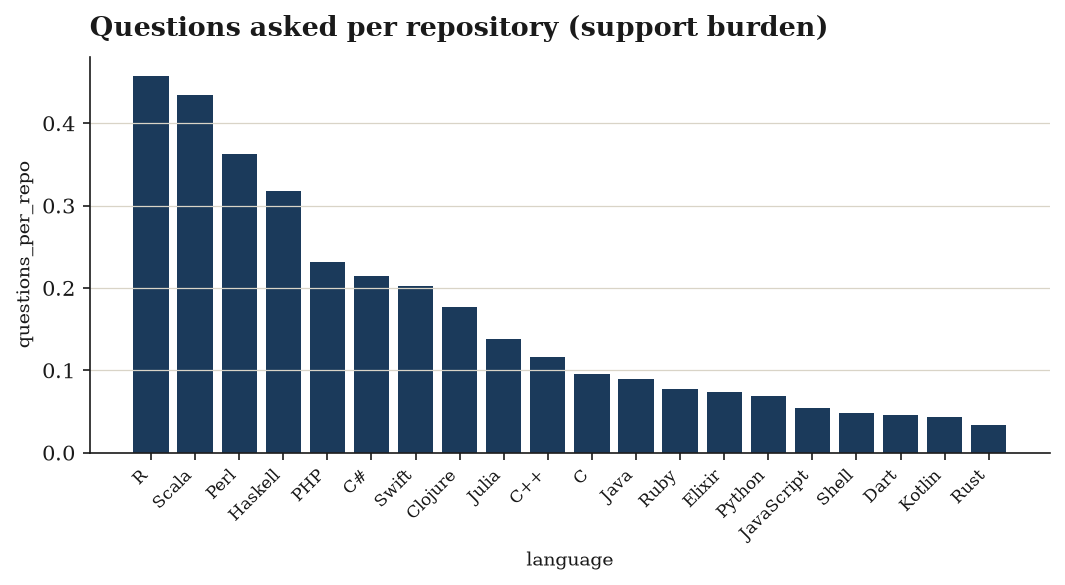
Q&A demand does not track repository supply.questions_per_repo varies 36-fold, from 0.0126 to 0.4578 (median 0.0833). The top repo language sits at +3.43 z-score while the top question language reaches +2.54 — the leaders on each axis are not necessarily aligned, and the median z-scores are both negative (-0.39 repos, -0.52 questions), meaning most languages sit well below the mean on both counts.
Tiering is heavily bottom-weighted. 15 of 24 languages are niche, versus 4 mainstream, 3 established, and just 2 dominant. Only one language is flagged is_top_decile. The adoption_score median of 5.52 against a mean of 17.27 (max 100) reflects the same long tail.
Charts included
Data preview
| language | gh_language | so_tag | repo_count | so_questions | questions_per_repo | repo_share_pct |
|---|---|---|---|---|---|---|
| C | C | c | 4246873 | 408036 | 0.09607916224478576 | 2.628989091028037 |
| C# | C# | c%23 | 7556480 | 1621937 | 0.2146418702888117 | 4.677771971653389 |
| C++ | C++ | c%2b%2b | 6997634 | 814168 | 0.11634904026132262 | 4.331823308351082 |
| Clojure | Clojure | clojure | 100284 | 17767 | 0.17716684615691436 | 0.06207992139267071 |
| Dart | Dart | dart | 2059851 | 94636 | 0.04594312889621628 | 1.2751325052911149 |
| Elixir | Elixir | elixir | 130918 | 9641 | 0.07364151606349012 | 0.08104362758651094 |
| Go | Go | go | 2448845 | 74464 | 0.030407804495588737 | 1.5159357933751616 |
| Haskell | Haskell | haskell | 163309 | 51837 | 0.3174166763619886 | 0.10109498905823125 |
First 8 of 24 rows and 9 further columns. The download carries every row and column.
Every column, defined
languagegh_language— GitHub Linguist language name used for the searchso_tag— Stack Overflow tag (URL-encoded)repo_count— public GitHub repositories with this primary languageso_questions— Stack Overflow questions carrying the tagquestions_per_repo— Q&A demand per repository — high = steep learning curve or legacy support loadrepo_share_pct(%) — share of the cohort's repository basequestion_share_pct(%) — share of the cohort's tagged questionsrepo_zscorequestion_zscoreadoption_index— 0-1 min-max repository base within the cohortadoption_score— 0-100 composite of repository base and Q&A demandrepo_concentration_hhi— HHI of the whole language cohort's repository base (identical on every row)repo_gini— Gini of the cohort's repository base (identical on every row)adoption_tier— dominant | mainstream | established | nicheis_top_decile
Inside the PDF brief
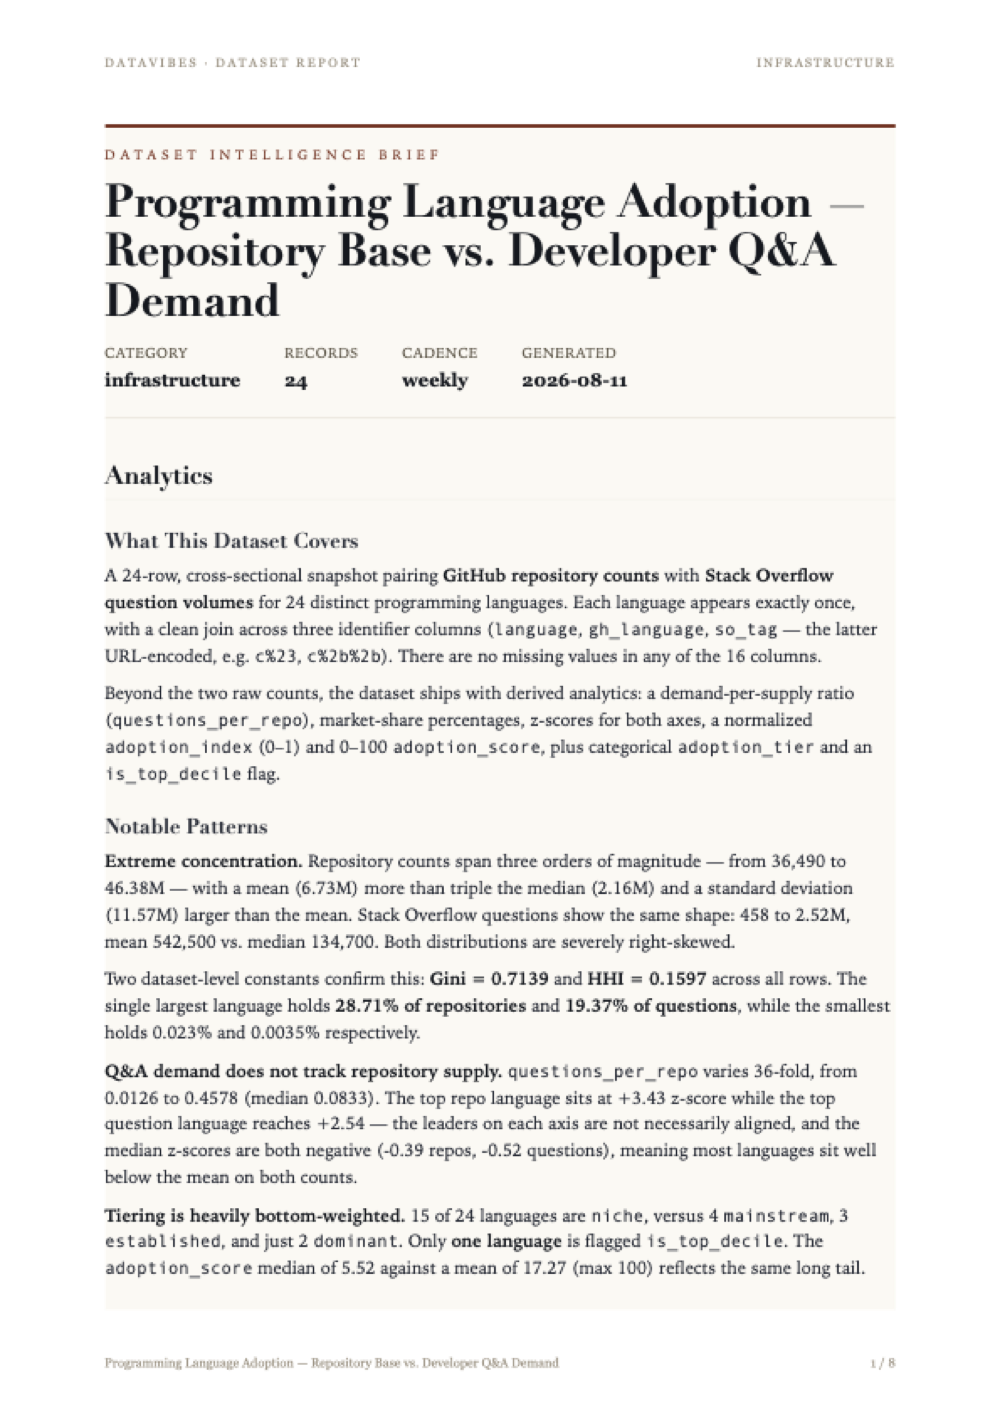
Every issue ships with a written brief: what the data covers, the patterns worth acting on, and the statistical work behind each derived column — with the limitations stated plainly rather than buried.
The page shown here is the first of the full report included in your download. Tap it to read at full size.
Method and limitations
Dataset Overview
The programming-language-adoption dataset (category: infrastructure) contains 24 rows and 16 columns, with one row per programming language. Every column is fully populated (24/24 non-null), and the three identifier columns — language, gh_language, and so_tag — each have 24 distinct values, confirming a one-to-one key relationship at the language grain.
The two raw measures are:
| Measure | Min | Median | Mean | Max | Stdev |
|---|---|---|---|---|---|
repo_count | 36,490 | 2.163e+06 | 6.731e+06 | 4.638e+07 | 1.157e+07 |
so_questions | 458 | 1.347e+05 | 5.425e+05 | 2.522e+06 | 7.794e+05 |
Both distributions are strongly right-skewed: the mean exceeds the median by roughly 3–4×, and the standard deviation exceeds the mean in both cases. This shape motivates most of the derivations described below.
Processing Pipeline
The work proceeded through a fixed, ordered sequence: normalize → join → sort → derive (×9) → score → classify → flag → validate.
- Normalize — canonicalisation of incoming fields prior to matching. The presence of URL-encoded tag values in
so_tag(c%23for C#,c%2b%2bfor C++) indicates that the Q&A side of the data retains its encoded tag form as the join-independent identifier. - Join — an inner alignment of the repository-side and Q&A-side records
on: ['language']. Becausegh_languageandso_tagboth remain at 24 distinct values with no nulls, the join resolved completely for every language; no fallout or unmatched-key handling is evidenced. - Sort — deterministic ordering
by: ['language'], which makes the output reproducible but carries no statistical weight.
Derived Metrics
Ratio: demand per unit of supply
questions_per_repo = ratio(so_questions, repo_count)
This is an intensity metric expressing how much Q&A demand each repository generates. Values span 0.01255 to 0.4578 (mean 0.1405, median 0.08336) — a roughly 36× spread. Because it is a ratio of two skewed magnitudes, it partially neutralises raw scale and separates languages with heavy per-repository question volume from those with large but quiet repository bases.
Standardisation: z-scores
repo_zscore = zscore(repo_count) and question_zscore = zscore(so_questions)
Each measure was recentred and rescaled to mean 0, unit standard deviation. The profile confirms the transform executed correctly: both columns report stdev = 1 and means at floating-point zero (1.576e-17 and -1.272e-17). Critically, both z-score distributions retain the original skew — the medians sit well below zero (-0.3948 and -0.5233) while the maxima reach +3.427 and +2.540. Standardisation therefore rescaled the axes but did not symmetrise them; the bulk of languages sit below their respective means.
Min–max normalisation and the adoption index
adoption_index = minmax_normalize(repo_count)
Rescaling to the unit interval yields min = 0 and max = 1 by construction. The mean (0.1444) and median (0.04588) sit far below the midpoint, again reflecting that a small number of very large repository bases stretch the upper end of the range. This index is a single-variable transform of repo_count alone.
Concentration measures
repo_concentration_hhi = hhi(repo_count) → 0.1597repo_gini = gini(repo_count) → 0.7139
Both are whole-population statistics broadcast identically to all 24 rows (stdev = 0 for each, min = max). They describe the distribution as a unit rather than the individual language:
- The Herfindahl–Hirschman Index of 0.1597 measures the sum of squared repository shares. Its reciprocal implies an effective-participant count of roughly 6.3 languages, i.e. the repository base behaves as though concentrated among about six equal-sized players despite 24 being present.
- The Gini coefficient of 0.7139 quantifies inequality in repository counts across languages, consistent with the skew already visible in the raw moments.
Share decomposition
repo_share_pct = share_of_total(repo_count) and question_share_pct = share_of_total(so_questions)
Both columns are percentages summing to 100 across 24 rows, which is why each has mean 4.167% (= 100/24) by arithmetic necessity. The dispersion differs meaningfully between the two sides:
| Share column | Min | Median | Max | Stdev |
|---|---|---|---|---|
repo_share_pct | 0.02259% | 1.339% | 28.71% | 7.163 |
question_share_pct | 0.003517% | 1.034% | 19.37% | 5.986 |
The repository side is the more concentrated of the two: its top share (28.71%) and standard deviation (7.163) both exceed the Q&A equivalents (19.37%, 5.986). Repository supply is thus more unevenly distributed than question demand across this language set.
Composite Scoring
adoption_score = score(weights = {repo_count: 0.6, so_questions: 0.4}, scale = 100)
A weighted composite placing 60% weight on repository base and 40% on Q&A question volume, rescaled to a 0–100 range. The observed span is the full 0 to 100 (mean 17.27, median 5.519, stdev 26.35). The score inherits the underlying skew: half of all languages score below 5.52 on a 100-point scale, and the mean is pulled up almost threefold by the leaders. The near-identical shape relative to adoption_index (mean 0.1444, median 0.04588) suggests the 0.6-weighted repository term dominates the composite.
Classification and Flagging
Tiering
adoption_tier = classify(adoption_score) using left-closed lower bounds, evaluated top-down, with default: 'unknown':
| Tier | Rule | Count | Share of 24 |
|---|---|---|---|
| dominant | score ≥ 60 | 2 | 8.3% |
| mainstream | 25 ≤ score < 60 | 4 | 16.7% |
| established | 8 ≤ score < 25 | 3 | 12.5% |
| niche | score < 8 | 15 | 62.5% |
All 24 rows resolved to a named tier — unknown does not appear among the 4 distinct values, so the default branch was never exercised. The distribution is a steep pyramid: nearly two-thirds of languages fall into niche, and only two reach dominant. Note that the established cut-point of 8 sits just above the median score of 5.519, meaning the median language is a niche language.
Top-decile flag
is_top_decile = flag(adoption_index >= 0.9)
Exactly 1 of 24 rows (4.2%) satisfies the threshold; 23 are False. This is worth stating plainly: the flag name implies a decile (≈2.4 of 24 rows), but the rule is an absolute threshold on the min–max-normalised repository count, not a rank-based percentile. Because adoption_index is skewed, the 0.9 cut-off admits only the single largest language — the second-ranked language falls below 0.9 of the leader's repository count. The flag therefore identifies the outright leader, not the top 10% by rank.
Validation
A terminal validate step closed the pipeline. Its assertions are not specified in the profile; the observable evidence of success is the absence of nulls in all 16 columns and the internally consistent transform outputs (unit stdev on z-scores, 0–1 bounds on the index, 100/24 means on the share columns).
Limitations
- Very small sample. With n = 24, every distributional statistic is fragile. Tier counts of 2 and 3 rows are single-observation-sensitive: one language crossing a boundary shifts a tier's population by a third or a half.
- Concentration metrics are not row-level facts.
repo_concentration_hhiandrepo_ginihave zero variance by construction — they describe the 24-language aggregate. Filtering, subsetting, or re-slicing the rows will leave these values stale and misleading unless recomputed. - HHI and Gini are sample-bounded. Both are computed over this 24-language selection, not over all programming languages. Adding or removing languages mechanically changes both. An HHI of 0.1597 says nothing about global language concentration, only about concentration within the chosen set.
- Shares are closed to the sample.
repo_share_pctandquestion_share_pctsum to 100% over these 24 languages only. Their means are fixed at 100/24 by arithmetic and carry no information. adoption_indexandis_top_decileare single-variable. Despite the name "adoption", the index reflectsrepo_countalone; Q&A demand is excluded. The top-decile flag inherits this, so it is a repository-size flag, not an adoption flag.- The top-decile flag is mislabelled in effect. A fixed 0.9 threshold on a skewed normalised variable yields 1/24 = 4.2%, not 10%. Any downstream reading of "top decile" as a rank-based cohort will be wrong.
- Min–max normalisation is outlier-anchored. Both endpoints of
adoption_indexare set by single extreme observations. A change to the largest or smallest language rescales the entire column and can silently move the 0.9 flag boundary. - Weights are unjustified by the data. The 0.6/0.4 split between repositories and questions is an imposed editorial judgement. No sensitivity analysis over alternative weightings is present, and because the repository measure is both more heavily weighted and more dispersed (share stdev 7.163 vs. 5.986), the composite is effectively a repository ranking with a Q&A adjustment.
- Tier cut-points are unexplained. The 60/25/8 boundaries are exogenous. Placing
establishedat 8 while the median score is 5.519 means the labelling is calibrated to the leaders rather than to the observed distribution's centre. - Skew is rescaled but never corrected. No log or rank transform was applied. Every derived column — z-scores, index, score — retains median-far-below-mean asymmetry, so means and standard deviations are poor summaries throughout, and the z-scores should not be interpreted as normal-theory quantiles.
- Ratio metric is unstabilised.
questions_per_repodivides two skewed magnitudes with no smoothing or denominator floor. Languages with small repository bases can produce volatile ratios, and the 36× observed spread may partly reflect that instability rather than genuine differences in demand intensity. - Join and normalisation details are opaque. The
normalizestep's rules are unspecified, and the join relies onlanguagematching across two sources whose own keys differ in form (plaingh_languagevs. URL-encodedso_tag). Any mapping error — a language whose GitHub name and Stack Overflow tag do not refer to the same thing — would be invisible here, since the profile only confirms that all 24 keys matched, not that they matched correctly. - No temporal dimension. There is no timestamp, vintage, or period column. Repository counts and question counts are cumulative-looking snapshots of unknown and possibly differing as-of dates; "adoption" is measured as accumulated stock, not current activity or growth.
- Validation is undocumented. The
validatestep's checks and thresholds are not recorded, so the strength of the quality guarantee cannot be assessed. - Descriptive only. No correlation, regression, or significance testing was performed between the repository and Q&A measures. The pipeline ranks and labels; it does not establish any relationship between supply and demand.
Provenance
Source: GitHub Search API (repository counts); Stack Exchange API (Stack Overflow tag counts)
Licence: GitHub REST API terms; Stack Exchange content CC-BY-SA-4.0
Collected and derived with datavibes, a deterministic pipeline: the same config and timestamp always reproduce the same file.