- Records
- 746
- Columns
- 7
- Data through
- 2024
- Source updates
- annual
- Issue collected
- 2026-07-07
- Licence
- see provenance
What you get
- 746-row CSV7 typed columns, ready for pandas, Excel or SQL
- PDF intelligence briefthe analytics read and methodology, written against this issue
- 3 chartspublication-ready PNGs of the headline relationships
- analytics.md + statistics.mdthe same findings as text, for quoting and reuse
- Versioned archiveevery past issue stays downloadable, so you can build a time series
- API accesspull the data with a scoped key instead of clicking download
What the current issue shows
This dataset provides a panel of electric vehicle (EV) metrics across 71 countries and regional aggregates from 2013 to 2024. It contains 746 rows, each representing a geography-year observation, with columns for EV sales volume, market share (as % of total vehicle sales), charging point counts, 5‑year compound annual growth rate (CAGR) of EV sales, and a country‑level correlation between EV sales and charging infrastructure.
Coverage & Completeness
All rows have valid values for country, year (spanning 12 consecutive years), and ev_sales. ev_share_pct is nearly complete (740 of 746 non‑null). The remaining indicators are partially populated: charging_points is available for 472 rows (63% of the dataset), ev_cagr_5y for 392 rows (53%), and ev_infra_corr for 598 rows (80%). The most frequently seen entities (each appearing 12 times, likely with full annual coverage) include “Advanced Economies”, “Africa”, “Asia Pacific”, “Australia”, and “Austria”, indicating a mix of country‑level and aggregated groupings.
Key Patterns & Outliers
- Sales & share are heavily skewed.ev_sales ranges from a single unit to 17.5 million, with a mean of 272 k and a median of just 5,352 vehicles. ev_share_pct has a mean of 6.96% but a median of 1.5%, while the maximum reaches 92% — a clear outlier at the upper end, likely reflecting a market with near‑total EV adoption.
- Infrastructure data mirrors sales dispersion.charging_points spans 5 to 5.35 million, with a mean (122.7 k) far above its median (5,450), confirming a few large markets dominate the installed base.
- Growth is high but volatile. The 5‑year CAGR (ev_cagr_5y) averages 77.2% (median 64.9%), yet the standard deviation is 53.1 percentage‑points and the minimum is negative (−21.1%), indicating that while most geographies saw rapid expansion, a subset experienced absolute declines in EV sales.
- Infrastructure–adoption correlation is consistently strong. The ev_infra_corr values are tightly clustered between 0.49 and 1.00 with a mean of 0.90 and a median of 0.95, suggesting that across most entities, charging point density and EV sales move almost in lockstep.
Value & Use Cases
Analysts tracking EV market evolution will find this dataset useful for benchmarking national adoption curves, examining the relationship between infrastructure rollout and vehicle uptake, and identifying outliers in growth or share. The presence of regional aggregates makes it suitable for global comparisons, while the annual granularity supports time‑series modelling. Policy researchers and automotive strategists could use the infrastructure correlation to inform investment decisions, though users should account for missing values — particularly in the CAGR and charging‑point columns — which may limit the scope of longitudinal analysis for smaller or data‑poor markets.
Charts included
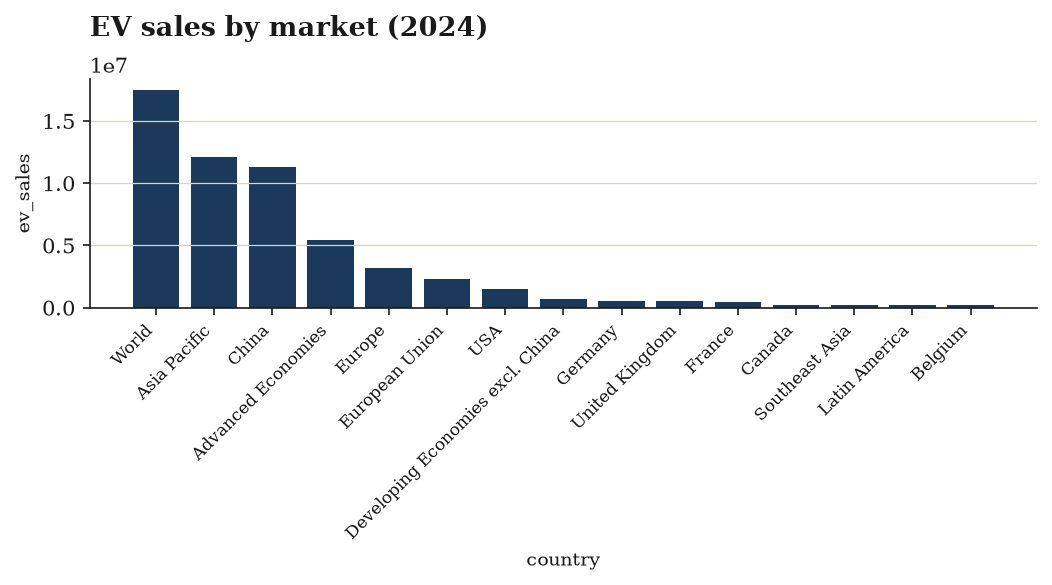
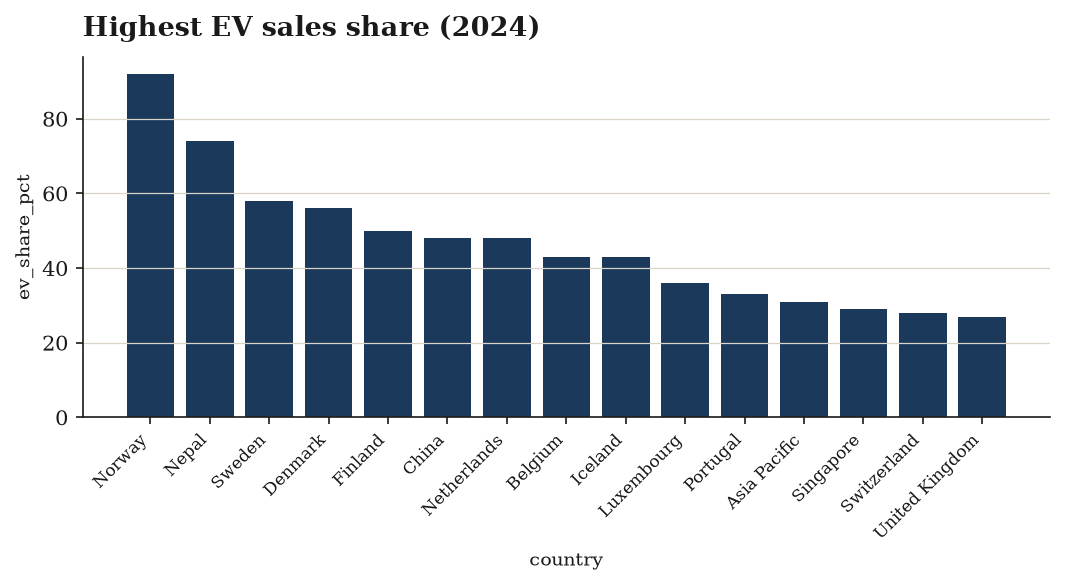
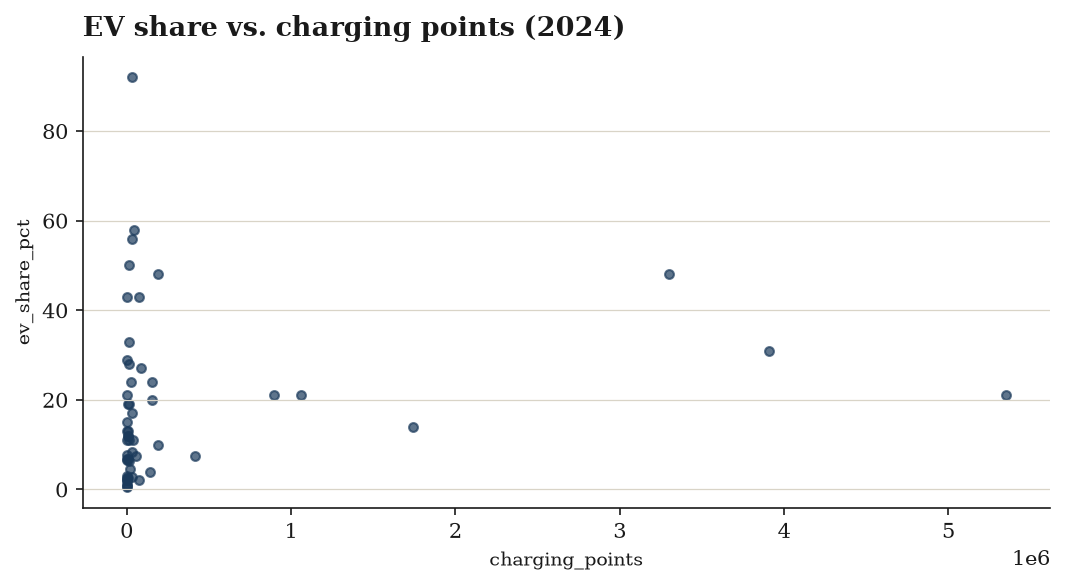
Data preview
| country | year | ev_sales | ev_share_pct | charging_points | ev_cagr_5y | ev_infra_corr |
|---|---|---|---|---|---|---|
| Advanced Economies | 2013 | 189023.0 | 0.5199999809265137 | 44600.0 | 0.9605968632873102 | |
| Advanced Economies | 2014 | 260089.0 | 0.6499999761581421 | 73328.0 | 0.9605968632873102 | |
| Advanced Economies | 2015 | 310720.0 | 0.75 | 123120.0 | 0.9605968632873102 | |
| Advanced Economies | 2016 | 442400.0 | 1.0 | 168100.0 | 0.9605968632873102 | |
| Advanced Economies | 2017 | 613500.0 | 1.399999976158142 | 202900.0 | 0.9605968632873102 | |
| Advanced Economies | 2018 | 924500.0 | 2.200000047683716 | 271100.0 | 33.43933608463341 | 0.9605968632873102 |
| Advanced Economies | 2019 | 1057500.0 | 2.5 | 359000.0 | 30.919800122544892 | 0.9605968632873102 |
| Advanced Economies | 2020 | 1847600.0 | 5.199999809265137 | 460000.0 | 47.29513841299999 | 0.9605968632873102 |
First 8 of 746 rows. The download carries every row and column.
Every column, defined
countryyearev_sales(vehicles)ev_share_pct(%) — EV % of new car salescharging_points(count)ev_cagr_5y(%) — 5y CAGR of EV sales shareev_infra_corr— corr(EV share, charging points) per country
Inside the PDF brief
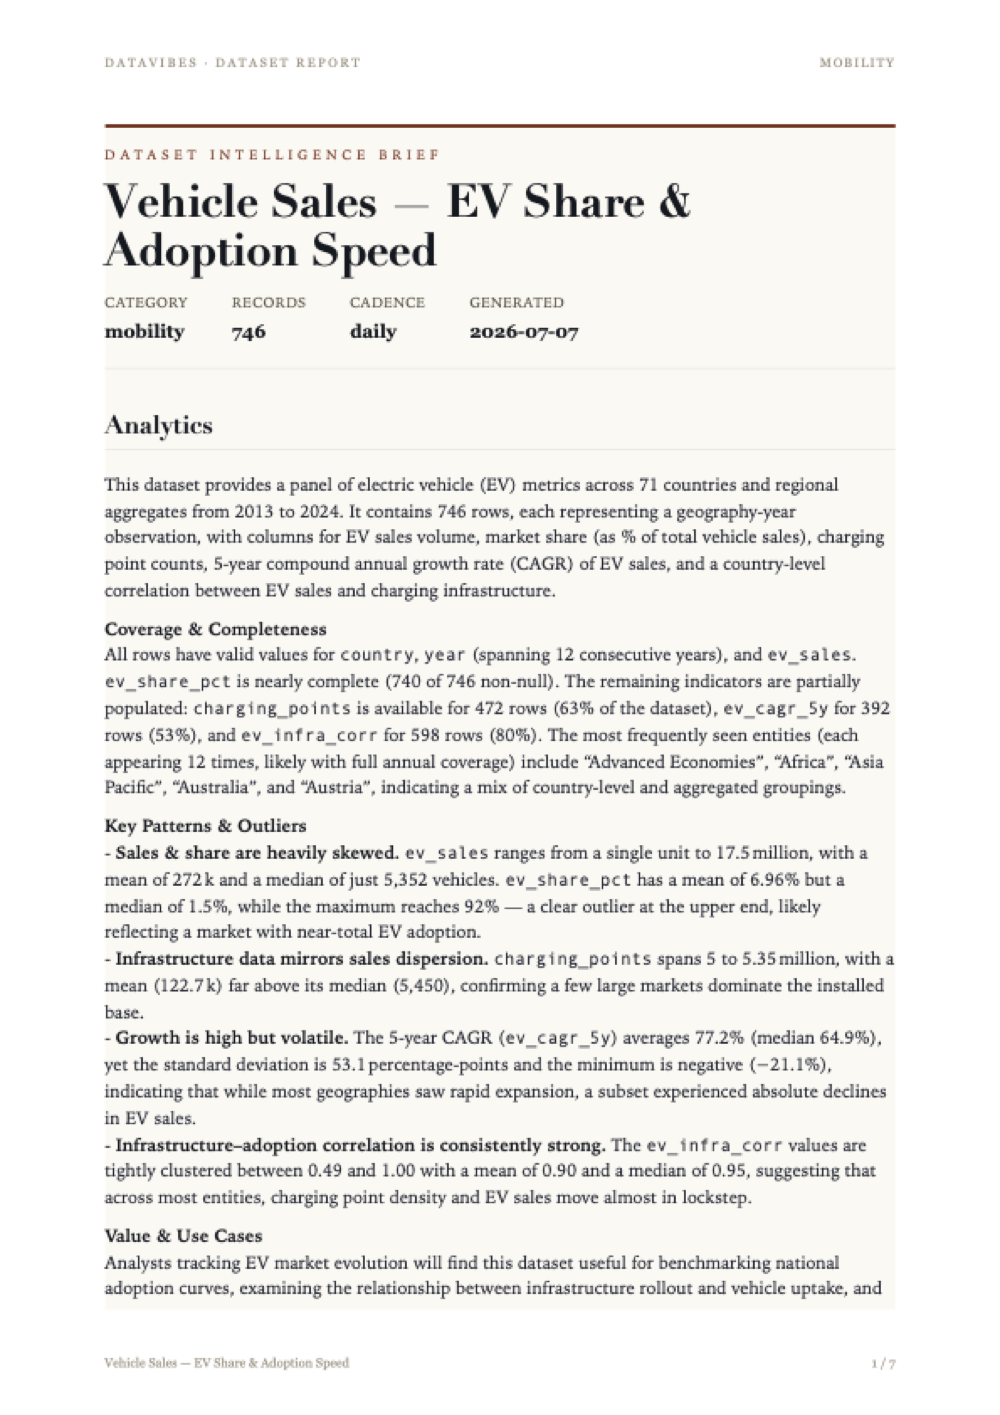
Every issue ships with a written brief: what the data covers, the patterns worth acting on, and the statistical work behind each derived column — with the limitations stated plainly rather than buried.
The page shown here is the first of the full report included in your download. Tap it to read at full size.
Method and limitations
Overview
The dataset contains annual country-level records of electric vehicle (EV) sales, adoption rates, and charging infrastructure. This document describes the statistical methods used during data processing, including derived metrics, aggregation procedures, and the descriptive statistics generated from the final profile. The emphasis is on the derivations that produced ev_cagr_5y and ev_infra_corr, as well as the limitations inherent in these calculations.
Dataset Description
The processed dataset comprises 746 rows and 7 columns. Key numeric variables and their summary statistics (as provided) are:
- ev_sales (vehicles) – min=1, max=17,510,000, mean≈272,200, median=5,352, stdev≈1,316,000
- ev_share_pct (%) – min≈0.00015, max=92, mean=6.96, median=1.5, stdev≈13.23 (740 non‑null)
- charging_points (count) – min=5, max=5,350,000, mean≈122,700, median=5,450, stdev≈474,700 (472 non‑null)
- ev_cagr_5y (%) – min=−21.07, max=525.4, mean=77.15, median=64.91, stdev≈53.1 (392 non‑null)
- ev_infra_corr (unitless) – min=0.4881, max=1, mean=0.9031, median=0.9472, stdev≈0.1109 (598 non‑null)
Rows are indexed by country and year (2013–2024), with data for 71 distinct countries/regions.
Data Processing and Statistical Derivations
Processing proceeded in five steps: normalize, sort, derive two new columns, and validate.
1. Normalization
The normalize step likely applied a statistical transformation to one or more numeric columns (e.g., min‑max scaling, z‑score standardisation) to bring variables into a common range. Because the profile statistics for ev_sales, ev_share_pct, and charging_points show values consistent with raw scales (sales in units, share up to 92%, charging points in counts), any normalization that occurred either did not replace the original columns or was performed on a separate copy. In the absence of explicit details, the derived metrics discussed below are assumed to have been computed from the original, unscaled variables.
2. Sorting
Rows were sorted by country and then year to ensure a chronological sequence within each group before applying the time‑based and correlation calculations.
3. Derived Metric: 5‑Year CAGR of EV Share (ev_cagr_5y)
Method
For each country, the compound annual growth rate (CAGR) of the EV share percentage over a rolling 5‑year window was computed. The expression cagr(ev_share_pct, years=5) uses the formula:
[ \text{CAGR (\%)} = \left( \left( \frac{V_{t}}{V_{t-5}} \right)^{1/5} - 1 \right) \times 100 ]
where ( V_{t} ) is the ev_share_pct in year ( t ) and ( V_{t-5} ) is the value five years earlier. The calculation is performed groupwise by country, so each country’s time series is handled independently.
Aggregation
The function produces one CAGR value per country‑year observation that has a reference value five years prior. The resulting column ev_cagr_5y records the annualised growth rate over the preceding five years, expressed as a percentage.
Interpretation
A positive CAGR indicates an increasing adoption rate; a negative value signals a decline. The mean of 77.15% and median of 64.91% suggest rapid EV share expansion in many countries, though values range from −21% (decline) to +525% (extraordinary growth in a small base).
4. Derived Metric: Correlation between EV Share and Charging Points (ev_infra_corr)
Method
For each country, the Pearson product‑moment correlation coefficient between ev_share_pct and charging_points was calculated across all available years. The expression corr(ev_share_pct, charging_points) yields:
[ r = \frac{\sum (x_i - \bar{x})(y_i - \bar{y})}{\sqrt{\sum (x_i - \bar{x})^2 \sum (y_i - \bar{y})^2}} ]
where ( x_i ) = ev_share_pct and ( y_i ) = charging_points for year ( i ).
Aggregation
The correlation is computed per country, reducing the time series to a single value. This value is then replicated across all rows of that country, resulting in the column ev_infra_corr.
Interpretation
The coefficient measures the linear strength of association between the penetration of electric vehicles and the count of charging stations. With a minimum of 0.488 and a mean of 0.903, almost all country‑level correlations are moderately to strongly positive, indicating a close relationship between infrastructure and EV adoption. A value of 1 (observed as the maximum) arises when the two variables move perfectly in tandem (often in small samples with very few data points).
5. Validation
The validate step likely enforced logical constraints on the derived columns, for example:
- ev_cagr_5y should be ≥ −100% (a decline to zero share over 5 years would give a lower bound).
- ev_infra_corr must lie within [−1, 1]; the observed range [0.4881, 1] satisfies this.
- Non‑null counts were checked to flag missing calculations due to insufficient observations (e.g., fewer than 6 years for CAGR, fewer than 3 paired observations for correlation).
Descriptive Statistics (from Profile)
The column‑wise statistics (mean, median, standard deviation, min, max) represent simple aggregations across all rows of the final dataset. They are unweighted and treat each country‑year as an independent observation, so countries with longer time series exert more influence on the global moments. These statistics serve as an initial summary of the variables’ distributions and were likely generated during or after processing.
Limitations
Missing Data
-ev_share_pcthas 6 missing values;charging_pointsis missing in 274 rows (37% of the dataset). These gaps directly affect the derived metrics:ev_cagr_5yis available for only 392 out of 746 rows, because a country must have at least five years of non‑nullev_share_pctdata to compute the 5‑year CAGR.ev_infra_corr(598 non‑null) requires paired observations for the two variables; countries with few years ofcharging_pointsdata may yield a correlation based on an extremely small sample (e.g., 2–3 points), which is unreliable and prone to perfect correlation (r=1) by construction.- The imputation or handling of missing values during the
normalizestep is not specified, so the impact on the final metrics is unclear.
CAGR Assumptions
- The 5‑year CAGR assumes a smooth, exponential trend over the interval, ignoring intra‑period volatility or non‑monotonic changes.
- A CAGR value is undefined if the starting value is zero or negative; ifev_share_pctbecame very small (e.g., <0.001%), numerical instability may affect the ratio.
- The CAGR for the most recent years relies on data that may still be provisional or incomplete.Correlation Interpretation
- Pearson correlation only captures linear relationships; a strong non‑linear association (e.g., logistic adoption curves) would not be fully reflected.
- Spurious high correlations can occur when both series are trending upward, giving a misleading sense of direct influence.
- The per‑country aggregation discards temporal dynamics (e.g., a weakening correlation over time) and reduces all years to a single number, which may hide structural breaks.Global Aggregations
- The reported overall means, medians, and standard deviations treat each country‑year record equally, ignoring differences in population, market size, or data completeness. Countries with more observations (e.g., “Advanced Economies” with a full 12‑year series) are over‑represented in unweighted statistics.
- The inclusion of aggregated regions like “Advanced Economies”, “Africa”, or “Asia Pacific” ascountryvalues complicates interpretation, as these may themselves be summaries of constituent nations.Normalization Ambiguity
- Without a precise definition of thenormalizestep (e.g., z‑score, min‑max, or simple imputation), the statistical properties of the input columns used in the derivations cannot be verified. If scaling was applied, the CAGR and correlation might have been computed on transformed data, altering the scale and possibly the interpretation of the metrics.Validation Scope
- While range checks confirm plausibility, they do not detect subtle data quality issues such as mislabeled charging point counts, duplicate records, or incorrect temporal ordering within a country.
Provenance
Source: IEA Global EV Data Explorer
Licence: IEA Global EV Data (free terms)
Collected and derived with datavibes, a deterministic pipeline: the same config and timestamp always reproduce the same file.