- Records
- 55
- Columns
- 25
- Data through
- 2026-08-11
- Source updates
- daily
- Issue collected
- 2026-08-11
- Licence
- see provenance
What you get
- 55-row CSV25 typed columns, ready for pandas, Excel or SQL
- PDF intelligence briefthe analytics read and methodology, written against this issue
- 4 chartspublication-ready PNGs of the headline relationships
- analytics.md + statistics.mdthe same findings as text, for quoting and reuse
- Versioned archiveevery past issue stays downloadable, so you can build a time series
- API accesspull the data with a scoped key instead of clicking download
What the current issue shows
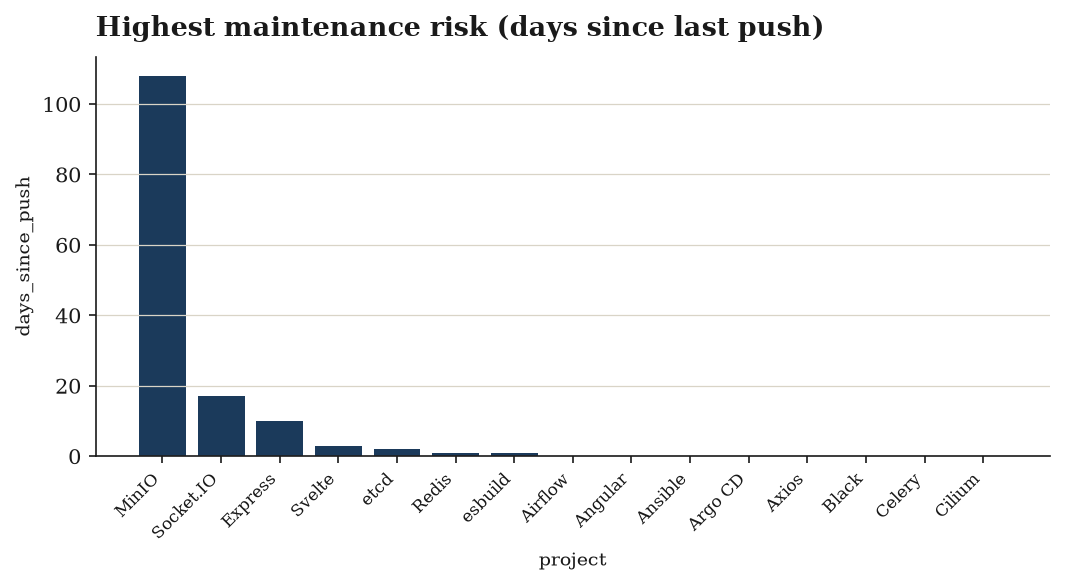
Everything here is alive.days_since_push has a median of 0 and a mean of just 2.58 days, meaning most projects were pushed to the same day the data was captured. Only one project is archived, one is flagged is_stale, and one falls into the watch risk class — maintenance_index averages 0.976 with a median of 1.0. This is a curated set of high-profile, actively maintained projects, not a representative sample of the long tail.
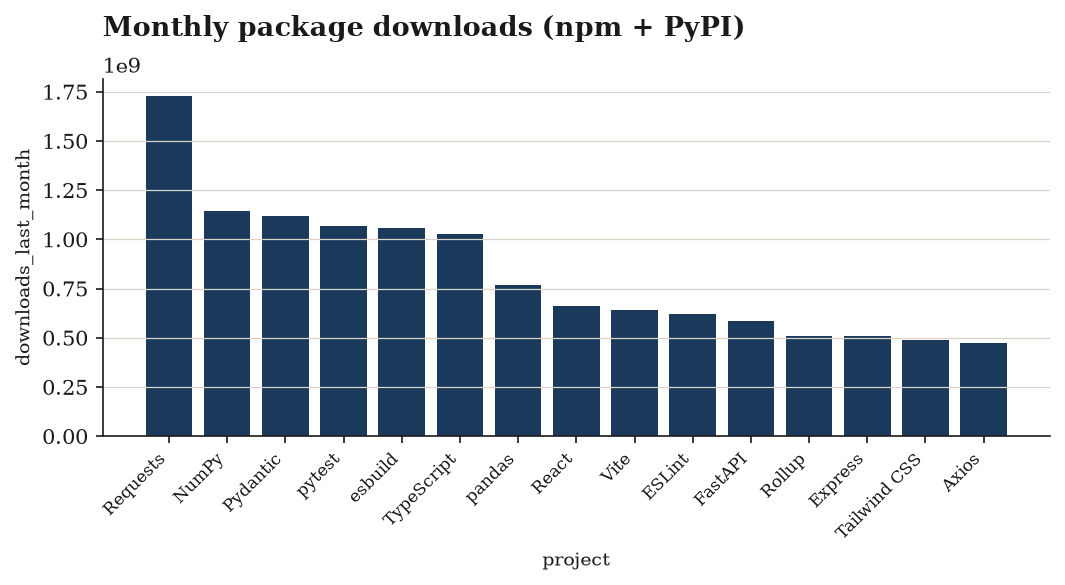
Popularity is extremely skewed. Stars range from 12,060 to 247,100 (mean 71,850 vs. median 64,400). Downloads are far more extreme: from 393,700 to 1.729 billion per 30 days, with a mean of 394M against a median of 226M and a standard deviation (411M) exceeding the mean — a classic heavy-tail distribution. Note that downloads_last_month and package are only populated for 40/55 rows, tracking the npm+pypi subset; the 15 infra projects have no registry package.
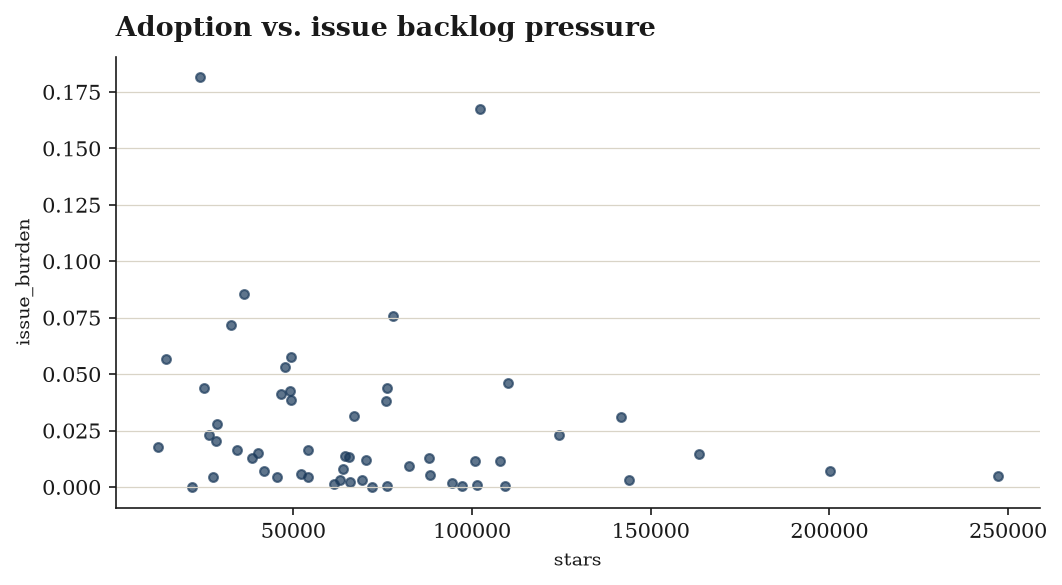
Issue backlogs are the real differentiator. With staleness and archival near-zero, is_backlogged is the only risk flag with meaningful variance: 21 of 55 projects (38%) are flagged. open_issues spans 0 to 17,120 (median 817), and issue_burden ranges from 0 to 0.18. Similarly, stars_per_day varies nearly 30x (3.54 to 103.3), separating steady veterans from breakout projects. Ages range from 1,394 to 6,351 days.
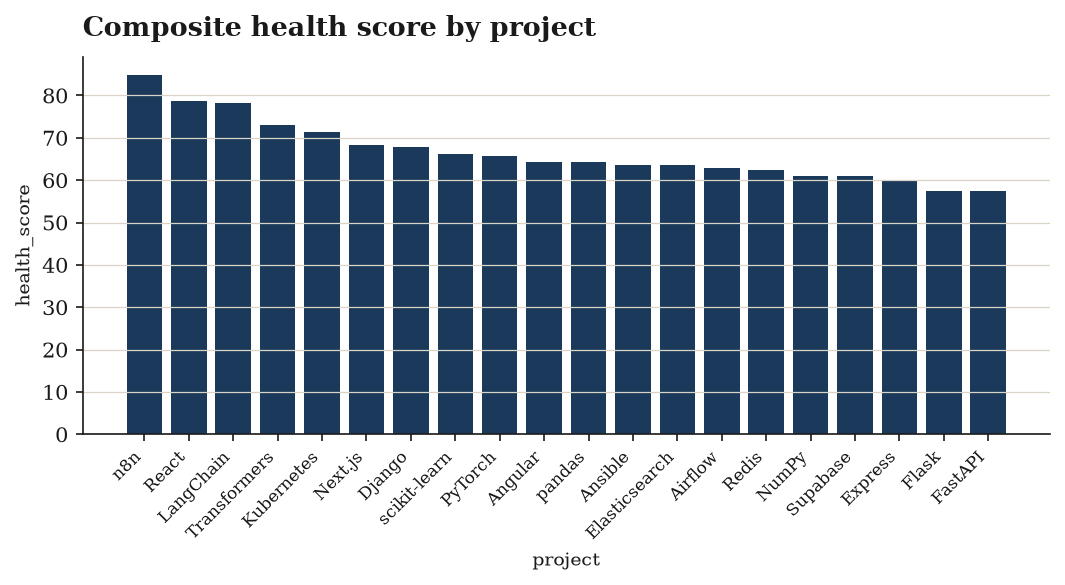
Health scores are moderate and normally shaped, averaging 56.2 (median 54.0, stdev 11.0), with one clear low outlier at 11.34 and a top score of 84.88.
Charts included
Data preview
| project | repo | ecosystem | package | primary_language | spdx_license | stars |
|---|---|---|---|---|---|---|
| Airflow | apache/airflow | pypi | apache-airflow | Python | Apache-2.0 | 46442 |
| Angular | angular/angular | npm | @angular/core | TypeScript | MIT | 100964 |
| Ansible | ansible/ansible | pypi | ansible | Python | GPL-3.0 | 70307 |
| Argo CD | argoproj/argo-cd | infra | Go | Apache-2.0 | 23888 | |
| Axios | axios/axios | npm | axios | JavaScript | MIT | 109219 |
| Black | psf/black | pypi | black | Python | MIT | 41792 |
| Celery | celery/celery | pypi | celery | Python | NOASSERTION | 28782 |
| Cilium | cilium/cilium | infra | Go | Apache-2.0 | 24910 |
First 8 of 55 rows and 18 further columns. The download carries every row and column.
Every column, defined
projectrepo— owner/name on GitHubecosystem— npm | pypi | infrapackage— registry package name, where one existsprimary_languagespdx_licensestarsforkswatchers— subscribers actively watching the repoopen_issues— open issues + pull requestsarchivedcreated_atpushed_atdays_since_push(days)days_since_creation(days)downloads_last_month(downloads/30d)issue_burden— open issues per 1k stars — unattended backlog pressurefork_ratio— forks ÷ stars — proxy for contributor intent vs. passive intereststars_per_day— lifetime star accrual rateattention_index— 0-1 min-max star rank within the cohortmaintenance_index— 0-1, 1 = most recently pushed in the cohorthealth_score— 0-100 composite of adoption, contribution and maintenance recencyrisk_class— healthy | watch | at-risk | criticalis_stale— no push in over 180 daysis_backlogged— issue backlog above 20 open issues per 1k stars
Inside the PDF brief

Every issue ships with a written brief: what the data covers, the patterns worth acting on, and the statistical work behind each derived column — with the limitations stated plainly rather than buried.
The page shown here is the first of the full report included in your download. Tap it to read at full size.
Method and limitations
Overview
The dataset profiles 55 open-source projects (one row per project, project and repo both fully distinct) across three ecosystems (npm = 20, pypi = 20, infra = 15), seven primary languages (Python = 19, TypeScript = 13, Go = 10, JavaScript = 8, plus C and two others) and six SPDX license values (MIT = 24, Apache-2.0 = 14, NOASSERTION = 9, BSD-3-Clause = 5, AGPL-3.0 = 2, plus one other). The statistical work converts raw repository counters and timestamps into ratio metrics, normalized indices, a weighted composite health score, and categorical risk labels.
1. Normalization and Record Assembly
normalize— a leading standardization pass over the raw fields prior to any derivation.joinonproject— record linkage keyed on the project name. This is the step that attaches registry-side information:packageanddownloads_last_monthare populated for only 40 of 55 rows (72.7%), i.e. the join is a left join with 15 unmatched projects (consistent with the 15infrarows having no package-registry counterpart).
2. Temporal Derivations (Age in Days)
Two age_days transformations convert ISO-8601 timestamps into integer day counts measured against a reference date:
| Derived column | Source timestamp | Min | Median | Mean | Max | Stdev |
|---|---|---|---|---|---|---|
days_since_push | pushed_at | 0 | 0 | 2.58 | 108 | 14.72 |
days_since_creation | created_at | 1394 | 4226 | 4215 | 6351 | 1290 |
days_since_push is extremely right-skewed: the median is 0 days and the mean is only 2.58 days, yet the standard deviation (14.72) exceeds the mean by ~5.7×, indicating that almost all projects were pushed to essentially today and a small number of outliers (up to 108 days) carry the entire dispersion. days_since_creation is by contrast near-symmetric (mean 4215 vs. median 4226), spanning roughly 3.8 to 17.4 years of project age.
3. Ratio Metrics
Three derive steps compute simple ratios:
fork_ratio = forks / stars— community-derivation intensity. Range 0.0334–0.4094, mean 0.1966, median 0.1860, stdev 0.1063. Mean ≈ median, so the distribution is roughly symmetric.issue_burden = open_issues / stars— open-issue load per unit of popularity. Range 0–0.1815, mean 0.02629, median 0.01346, stdev 0.0360. Mean is ~2× the median and the stdev exceeds the mean, marking a strongly right-skewed backlog distribution.stars_per_day = stars / days_since_creation— lifetime-average adoption velocity. Range 3.54–103.3, mean 20.23, median 12.91, stdev 18.58. Again right-skewed (mean 1.57× median), driven by a few fast-accumulating projects.
These ratios act as scale-invariant normalizers, expressing forks and issues relative to project popularity and stars relative to project age, so that large and small repositories become comparable.
4. Min–Max Normalized Indices
Two indices rescale a raw column to [0, 1] using the observed sample minimum and maximum:
attention_index = minmax_normalize(stars)— confirmed by the observed range 0–1. Mean 0.2543, median 0.2226, stdev 0.1928. Becausestarsranges from 12,060 to 247,100 with mean 71,850 and median 64,400, the normalized mean of ~0.25 reflects the same right skew present in the raw star counts: most projects sit in the lower quarter of the popularity span, anchored by a single maximum-star project mapped to 1.0.maintenance_index = minmax_normalize(days_since_push, invert=true)— inverted so that recent activity scores high. Range 0–1, mean 0.9761, median 1, stdev 0.1363. Since the mediandays_since_pushis 0, the majority of projects receive the maximum score of 1; the single 108-day project maps to 0. This index is therefore near-degenerate: it is effectively a constant 1 with a handful of downward outliers.
5. Weighted Composite Score
score builds health_score as a weighted linear combination scaled to 100:
health_score = 100 × ( 0.4·maintenance_index
                     + 0.2·attention_index
                     + 0.2·fork_ratio
                     + 0.2·stars_per_day )
Weights sum to 1.0, with maintenance recency given double the weight of each of the other three components. Resulting distribution: min 11.34, max 84.88, mean 56.16, median 53.98, stdev 11.01 — mildly right-skewed and considerably tighter than any single input component.
6. Classification and Flagging
classify bins days_since_push into risk_class using cumulative upper bounds, with default: unknown:
| Bin | Threshold | Label | Observed count |
|---|---|---|---|
| 1 | ≤ 30 days | healthy | 54 |
| 2 | ≤ 180 days | watch | 1 |
| 3 | ≤ 365 days | at-risk | 0 |
| 4 | else | critical | 0 |
Only two of four classes are populated; the single watch case corresponds to the 108-day maximum push age.
flag produces two booleans:
is_stale— disjunctive (any) rule:days_since_push > 180orarchived == True. Observed: 1 True, 54 False. Given that no project exceeds 108 days since push, the sole True is attributable to the singlearchived == Truerecord.is_backlogged— single condition:issue_burden > 0.02. Observed: 21 True (38.2%), 34 False. This is the only derived flag with meaningful class balance.
validate closes the pipeline as a terminal integrity check; all 55 rows survive with complete coverage on every column except package and downloads_last_month.
Limitations
- Sample size and coverage. With only 55 rows, distributional statistics are fragile, and per-ecosystem or per-language subgroups (e.g. C with 2 rows, AGPL-3.0 with 2 rows) are too small for reliable inference. The projects are evidently a curated set of large, prominent repositories (minimum 12,060 stars), so results do not generalize to the long tail of OSS.
- Missing join keys.
packageanddownloads_last_monthare null for 15 of 55 rows (27.3%). Any adoption analysis using downloads silently excludes the entireinfragroup, anddownloads_last_monthis not used inhealth_score, so real-world usage volume contributes nothing to the health ranking. - Sample-relative normalization.
attention_indexandmaintenance_indexare min–max scaled against this dataset's own extremes. Scores are therefore not comparable across datasets or over time, and adding or removing a single extreme project rescales every other row. - Degenerate maintenance index. With median
days_since_push= 0 and meanmaintenance_index= 0.9761, the highest-weighted component (0.4) is nearly constant. It contributes ~39 of the ~56 mean health points as a near-fixed offset, so effective discrimination between projects rests almost entirely on the three 0.2-weighted terms. - Unnormalized term in a normalized score.
fork_ratio(0.033–0.409) andstars_per_day(3.54–103.3) enter the weighted sum on their native scales alongside [0,1] indices.stars_per_dayin particular can contribute up to 0.2 × 103.3 × 100 = 2,066 points before scaling, so unless the scorer internally rescales, the composite is dominated by adoption velocity in a way the stated weights do not convey. The observedhealth_scoremaximum of 84.88 suggests some internal rescaling occurs, but the mechanism is not documented in the steps provided. - Arbitrary, unvalidated thresholds. The 30/180/365-day risk bins and the
issue_burden > 0.02backlog cutoff are fixed constants with no stated empirical or domain justification. The 0.02 threshold sits between theissue_burdenmedian (0.0135) and mean (0.0263), so it partitions the sample near its center by construction rather than at a recognized risk boundary. - Near-zero label variance.
risk_classis 54/1,is_stale54/1, andarchived54/1. Two of four risk classes are empty. These fields carry almost no information for modeling or comparison, and the single positive case in each is likely the same or an overlapping record. - Skew and outlier sensitivity.
issue_burden,stars_per_day,stars,open_issuesanddays_since_pushall show stdev at or above the mean, or mean well above median. Mean-based summaries and min–max scaling are both outlier-driven here; rank- or log-based treatments were not applied. - Proxy validity. Stars, forks and watchers are popularity signals, not measures of code quality, funding or contributor concentration. Despite the "bus-factor" framing in the dataset title, no contributor-count, commit-author or ownership-concentration field is present, so bus factor is not actually measured.
- Snapshot and timestamp semantics. All metrics derive from a single point-in-time capture; the
age_daysreference date is not specified, andpushed_atvalues in the profile fall in 2026, so recency figures are only interpretable relative to that unstated reference.pushed_atalso counts any push, including automated or documentation commits, and so overstates substantive maintenance.
Provenance
Source: GitHub REST API; npm registry download API; pypistats.org
Licence: Public repository + package-registry metadata (per-project licences vary)
Collected and derived with datavibes, a deterministic pipeline: the same config and timestamp always reproduce the same file.